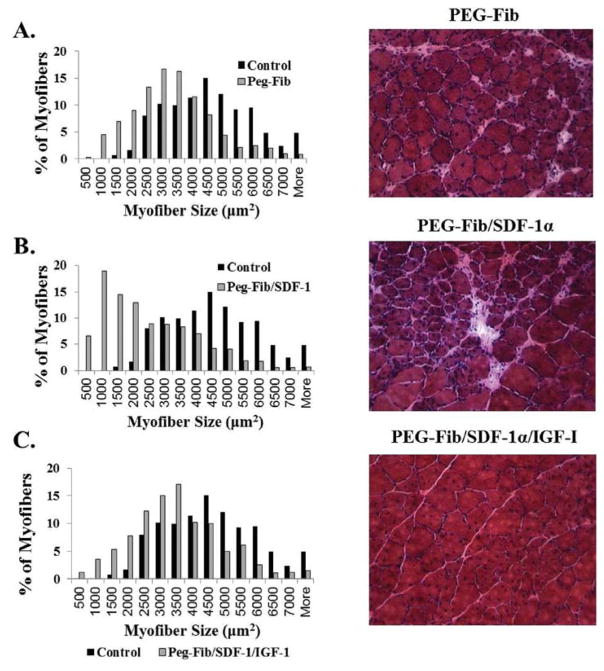
Fig. 6.
Histological analysis of I/R injured skeletal muscle 14 days post-reperfusion. H&E stained sections were examined for fiber size distribution (200×). Data expressed as percent myofibers of a given area (μm2). Representative images are included: (A) PEGylated fibrin (PEG-Fib), (B) PEGylated fibrin conjugated to SDF-1α (PEG-Fib/SDF-1α), (C) PEGylated fibrin conjugated to SDF-1α and IGF-I (PEG-Fib/SDF-1α/IGF-I).

