
Figure 3. Optical high-throughput screen of sodium channel modulators.
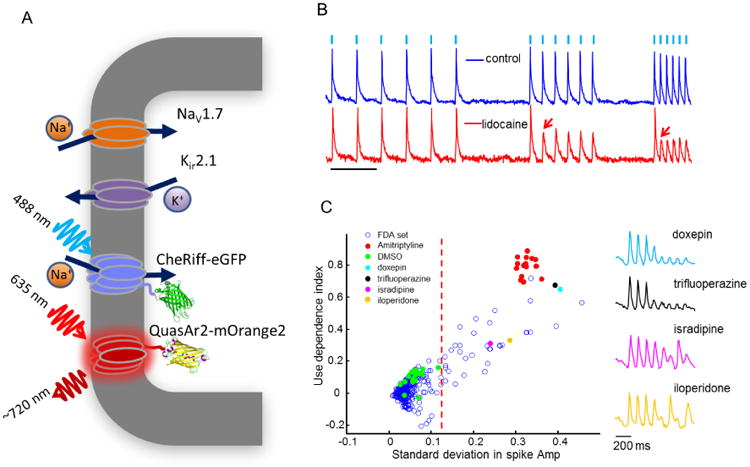
A) HEK293 cell engineered for optogenetic studies on NaV1.7. The cell stably expressed the test channel, NaV1.7, and Kir2.1 to lower the resting potential to near the K+ reversal potential. The blue light-activated ion channel CheRiff induced action potentials upon blue illumination. Fluorescence of the voltage indicator QuasAr2 reported the dynamics. B) Optically induced and optically recorded spikes followed the stimulus pattern in the absence of drug, but in the presence of a state-dependent blocker, lidocaine, the spikes failed at high stimulus frequency (arrows). Scale bar 1 s. C) All-optical screen of 320 FDA-approved compounds for use-dependent block. Each response was characterized by the overall decay in the spike amplitude (use-dependence index) and the standard deviation in the spike amplitude. State-dependent blockers showed clear functional clustering. Image adapted from [49].