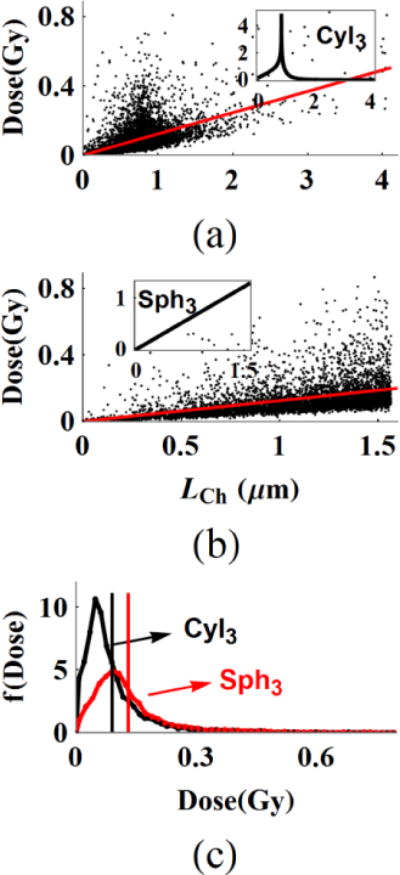
Figure 5.

The dose distribution of primary beam hits follow the product of chord length and chord length distribution in cylinders and spheres. The insets in (a, b) are the f(LCh) of the VCyl3 and VSph3. The linear slopes to the data sets, red lines are nearly equal in (a) and (b). The dose-frequency plot in (c) that is normalized by the number of events in the cylinder volume under the same fluence is plotted for the data sets on (a, b). The vertical black and red lines are the mean dose.
