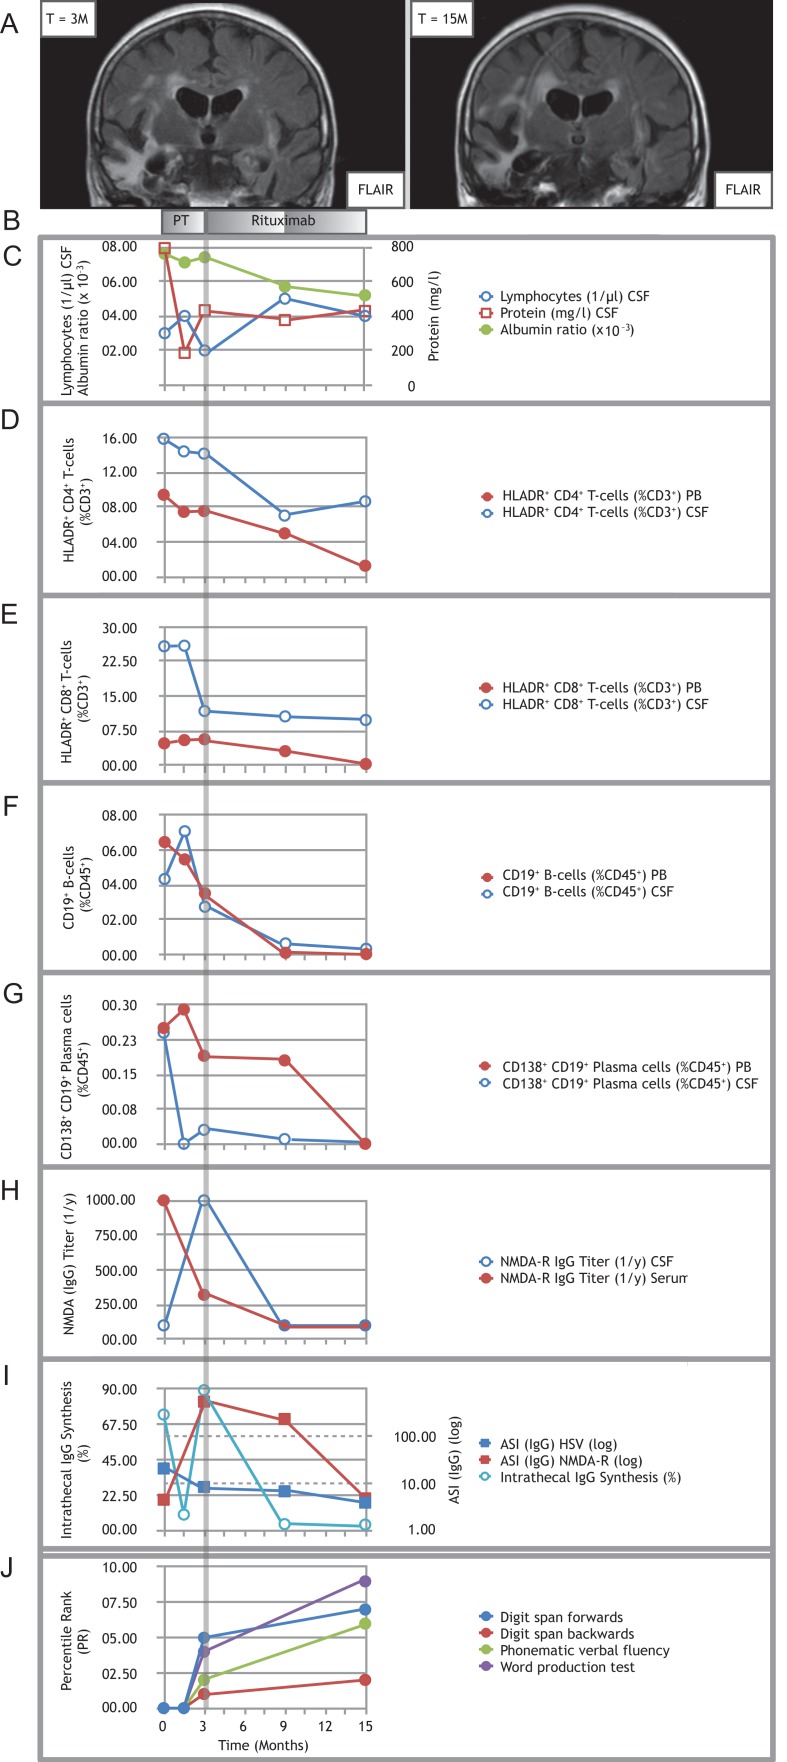
Figure 1:
Treating refractory post-herpetic anti-NMDA-receptor encephalitis with rituximab. (A) Representative MRI image (coronal FLAIR) showing right more than left temporal scarring before initiation of rituximab (left panel); follow-up MRI (coronal FLAIR) showing progressive atrophy involving both temporal lobes (right panel). (B) Pre-treatment (PT) consisted of multiple cycles of MP combined with PLEX and IA. Induction treatment with 2 × 200 mg rituximab was applied at month 3, maintenance doses with 1 × 200 mg were each applied at month 9 and 15. (C) Time course of CSF lymphocytes, CSF protein and albumin ratio. (D–G) Time courses of proportions of activated HLADR+ CD4+ T-cells (D), activated HLADR+ CD8+ T-cells (E), CD19+ B-cells (F) and CD138+ CD19+ plasma cells (G) in PB and CSF. Note: both CD8+ and CD4+ T-cells stained positive for CD3. Double labeling was avoided in the description and text for improved clarity. (H) Titers of anti-NMDA-R IgG autoantibodies over the course of the disease. (I) Time course of percentages of intrathecal IgG synthesis and the antigen-specific IgG antibody indices (ASI) for NMDA-R and HSV. All samples for antibody analysis at certain given time points were obtained before initiation of immunotherapy, especially before PLEX and IA. (J) Results of the neuropsychological assessment. Because of the severe impairment in the early stages of the disease, testing became first possible upon initiation of rituximab treatment (month 3) in a limited fashion with selected tests. It was repeated after 12 months of rituximab treatment (month 15). Percentile ranks for the word production test were calculated from internal control group data (N = 26). Note: In (C) and (I), circled data points are referenced by the lefthand y-axis (y1), whereas squared data points by the righthand y-axis (y2). Data T = −3 M is not shown, since the patient was not treated at our hospital at that stage.

