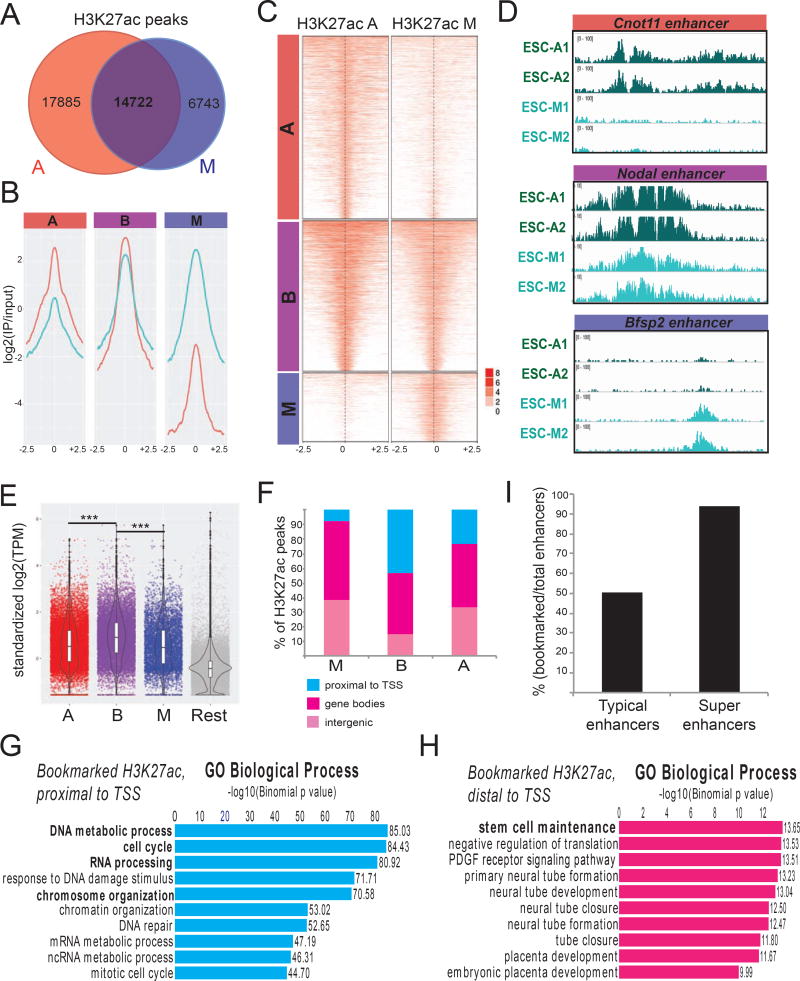
Figure 2. ChIP-seq experiments reveal distinct, but overlapping, patterns of H3K27 acetylation on asynchronous and mitotic ESCs.
A. Numbers of H3K27ac ChIP-seq peaks in asynchronous and mitotic ESCs and extent of overlap between them. B–C Averaged coverage (B) and enrichment (C) plots of H3K27ac ChIP-seq signals in mitotic and asynchronous ESCs. Bookmarked (B) H3K27ac peaks have comparable signal in both conditions, whereas (A) are preferentially-enriched in asynchronous and (M) in mitotic cells. ChIP-seq signals 2.5 kb upstream/downstream of peak centers are shown. D. Examples of H3K27ac tracks that belong in each of the A, B and M categories. E. mRNA levels of genes proximal to H3K27ac peaks that belong to each of the A, B or M categories. Published RNA-seq data from mouse ESCs (Shen et al. 2012) were used and standardized transcripts per million (TPM) were plotted. The most proximal gene to each peak was considered. Genes that were not assigned to any of the ChIP-seq peaks are shown as “Rest”. The expression levels of genes proximal to bookmarked H3K27ac sites were significantly higher compared to the other categories (p<0.001). F. Genomic distribution of each category of H3K27ac peaks relative to genes. Genome was partitioned into Proximal to TSS (including TSS and 1kb flanking regions), Gene bodies (excluding regions proximal to TSS) and Intergenic regions (rest of the genome). G–H. Top 10 Gene Ontology (GO) annotations enriched in bookmarked H3K27ac peaks that were either (G) proximal to TSS (<2.5kb) or (H) located >2.5 kb away from any TSS. I. Barplot showing the percentage of typical enhancers and super-enhancers that retain H3K27 acetylation during mitosis (Whyte et al., 2013).

