
Fig. 3.
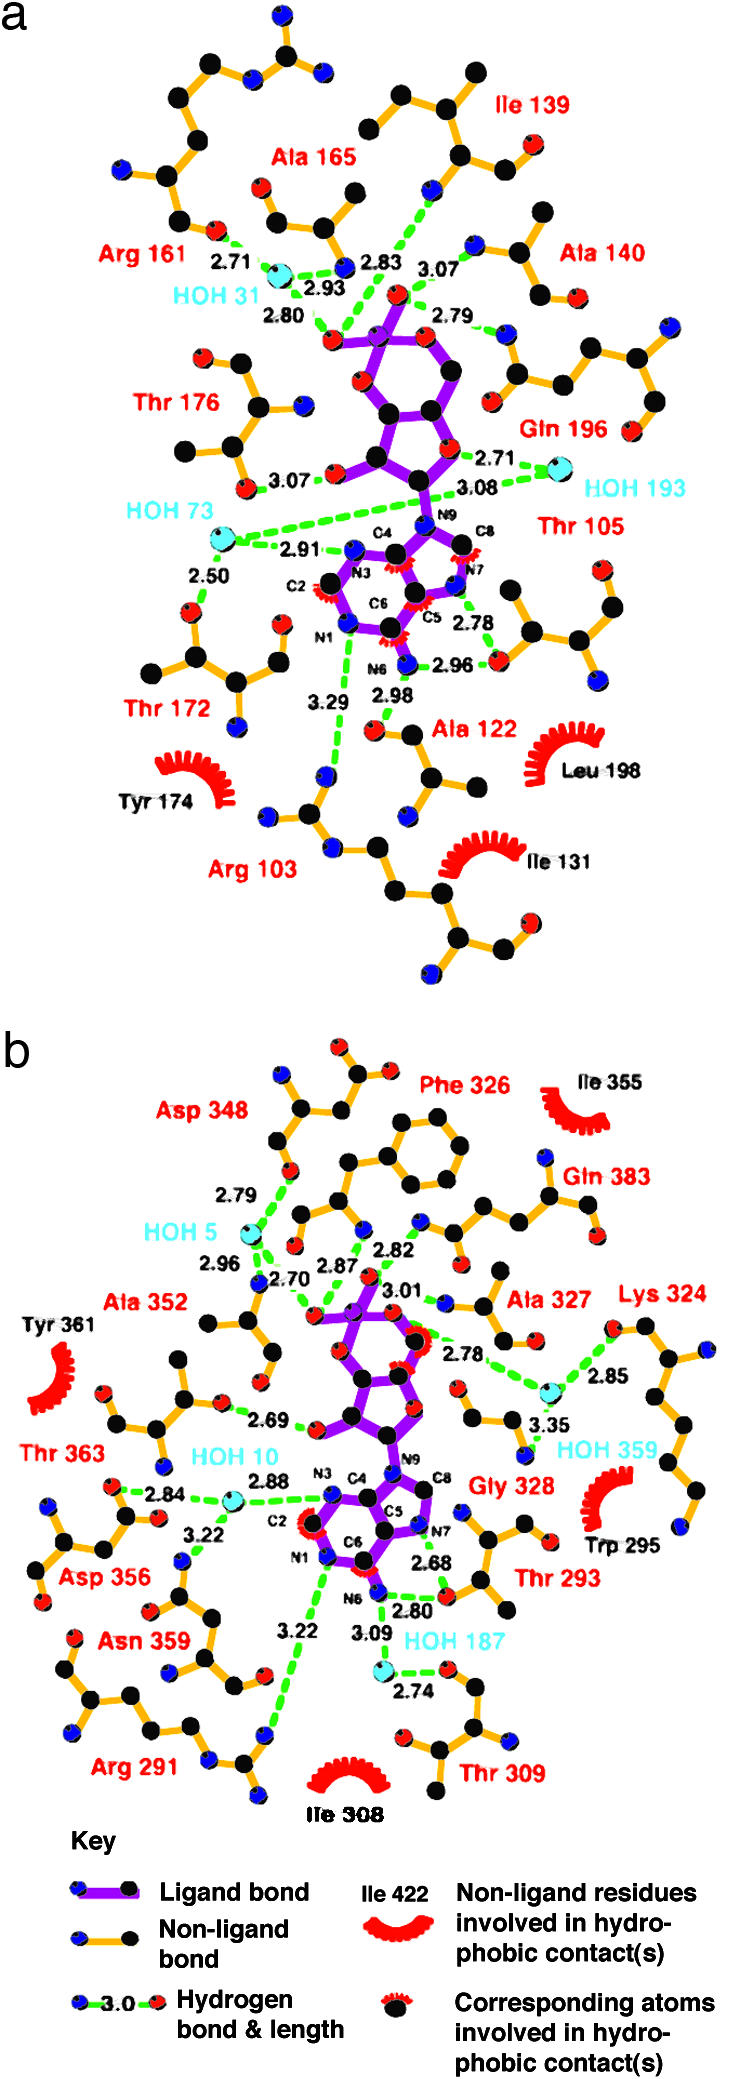
Diagram showing all of the close interactions between cAMP and AC cyaB2 GAF-A and -B, chain A. The figure was prepared with ligplot (27).
Official websites use .gov
A
.gov website belongs to an official
government organization in the United States.
Secure .gov websites use HTTPS
A lock (
) or https:// means you've safely
connected to the .gov website. Share sensitive
information only on official, secure websites.
Diagram showing all of the close interactions between cAMP and AC cyaB2 GAF-A and -B, chain A. The figure was prepared with ligplot (27).