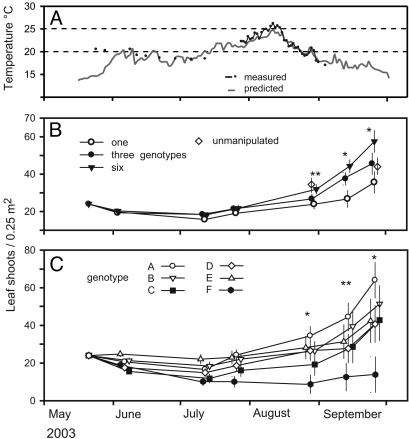
Fig. 1.
Water temperature and eelgrass growth. (A) Water temperatures from direct measurements at the experimental site, and predicted vales from a 45 km distant measurement point. The critical temperatures above which Z. marina ceases growing, or starts dying off, are depicted by dashed lines. (B and C) Comparison of mean leaf shoot density (±1 SE) among one-, three-, and six-genotype treatments, and among the six target genotypes, A–F, as monocultures (n = 4) is shown. B also gives natural shoot densities at the experimental site. Data points are set off for clarity. Asterisks indicate results of general linear models including blocking factor, initial density as covariate, and genotypic diversity as continuous predictor at each date. *, P < 0.05; **, P < 0.01.

