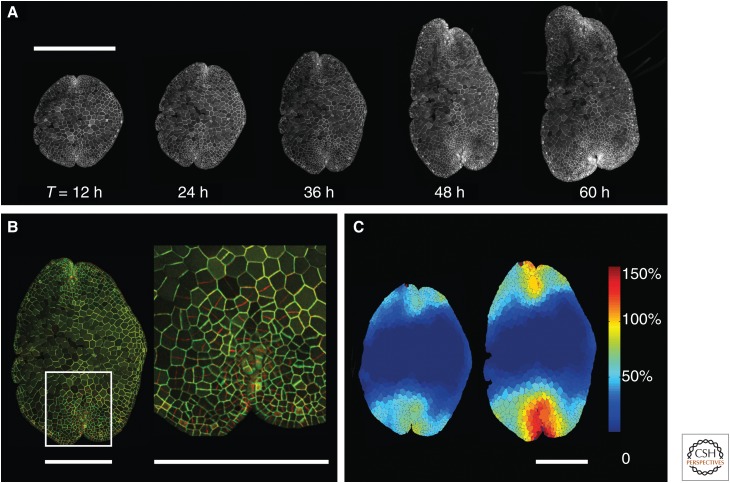
Figure 5.
Marchantia gemmae as testbeds for quantitative parameterization of plant growth. (A) A transgenic line of Marchantia was generated that expressed a green fluorescent protein localized to the plasma membrane. A gemma from this transgenic line was transferred to a nutrient agar surface and examined after 12, 24, 36, 48, and 60 h of growth using a Leica SP5 confocal laser scanning microscope. Z-series of optical sections were collected for the same gemma, and maximum intensity projections are shown for each point during growth. Scale bar, 500 µm. (B) The 24-h (green channel) and 36-h (red channel) images from the time course were matched using warp-registration image-processing techniques and overlaid. A white box is positioned over one of the apical notches, and this corresponds to the enlarged view shown in the inset. The frequency and orientation of apex-localized cell divisions can be directly visualized in a single gemma. Scale bar, 200 µm. (C) The plasma membrane-localized marker allows accurate segmentation of cell geometry during growth of living plants. Quantitative parameters such as cell expansion rate can be mapped across a single gemma. Measurements of percent clonal sector expansion per 12 h are shown as a color map. Scale bar, 200 µm.

