Figure 6.
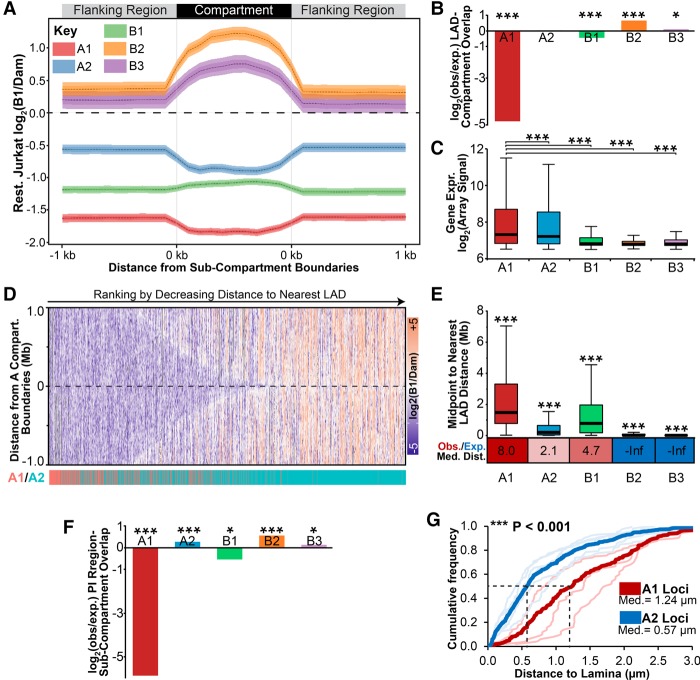
Compartments are distributed nonrandomly with respect to LADs. (A) Plot displaying the average log2(Lamin B1/Dam-only) signal from resting Jurkat T cells across all size-normalized A1, A2, B1, B2, or B3 GM12878 subcompartment regions and 1 kbp of flanking DNA. Compartment data from Rao et al. (2014). (B) Fold enrichment analysis of LADs observed (obs) in each compartment compared with that expected in a genome with randomly shuffled LADs (exp). (C) Box plot displaying the expression distribution in resting Jurkat T cells for each GM12878 subcompartment. (D) Heatmap of DamID log2(laminB1/Dam) signal across ±1 Mbp surrounding A subcompartment boundaries. Regions are ranked to the right by decreasing distance to nearest LADs, and their identity as an A1 or A2 subcompartment region is highlighted below in red or blue, respectively. A2 domains are observed more frequently closer to LADs than are A1. (E) Box plot displaying the distribution of chromosomal distances between the midpoint of subcompartment regions and the nearest LAD in resting Jurkat T cells. Below is the ratio between observed (Obs.) median distance and that expected (Exp.) in a randomly LAD-shuffled genome. Values are color-coded to show increased (red) or decreased (blue) observed distance compared with that expected. (F) Fold enrichment analysis of PI regions observed in each compartment compared with that expected in a genome with randomly shuffled PI regions. (G) Quantification of average distance between A1 (thick red line) or A2 loci (thick blue line) and the lamina determined by FISH for activated Jurkat T cells where PI loci are detached from the lamina. Lighter lines designate individual A2 (GBP, NFKBIZ, CBLB, CD200, BTLA) and A1 (IL2RA, CCND2, TNF) loci. Distance measurements were performed on a minimum of 50 nuclei per sample. (B,F) Significance was determined by Fisher's exact tests; (C,E) significance was by Dunn test for multiple comparison testing after a significant Kruskal-Wallis test. (G) Significance of the difference between A1 and A2 distances to lamina was determined by KS tests. (*) P < 0.05; (***) P < 0.001. See also Supplemental Figure S6.

