
Figure 8.
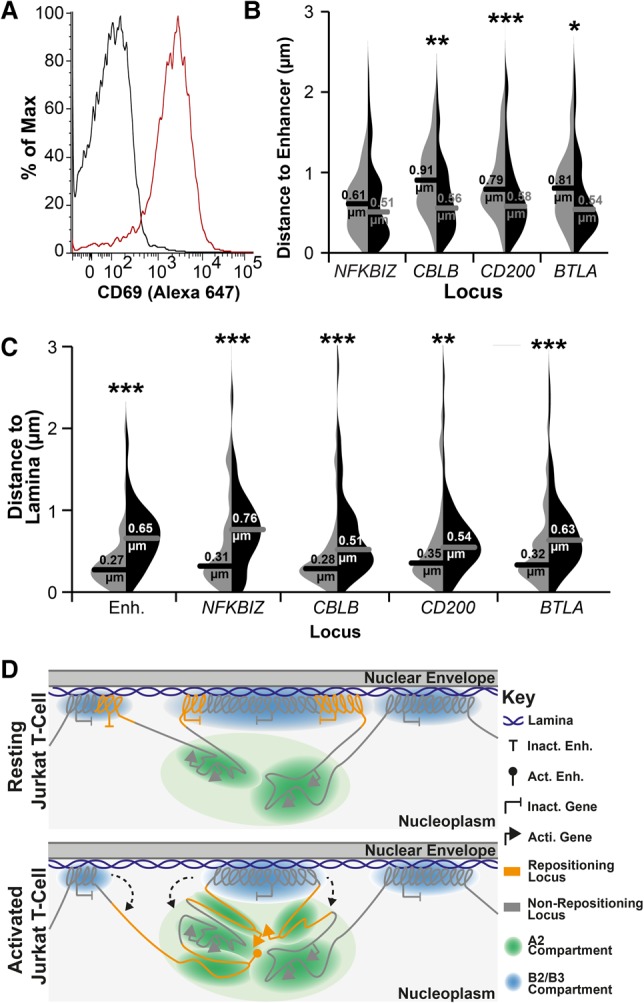
LAD release and association of genes in the nuclear interior also occurs in primary CD4+ T cells. (A) FACS plot of CD69 staining for naïve (resting; black line) and PMA-treated (activated; red line) CD4+ T cells, indicating 78% activation. For details of the naïve population, see also Supplemental Figure S8. (B) Violin plot quantification of distances between the predicted enhancer and indicated genes in naïve (light gray) and PMA-treated (black) cells. All loci displayed closer proximity to the predicted enhancer locus upon PMA activation of naïve CD4+ T cells. (C) Violin plot quantification of distances between indicated loci and Lamin B2 in naïve (light gray) and PMA-treated (black) cells. All loci displayed increased distance from the periphery upon PMA activation. For quantification statistics, relative distance measurements between loci or between loci and Lamin B2 were compared between the activated and resting cells by KS tests. (*) P < 0.05; (**) P < 0.01; (***) P < 0.001. Distance measurements were performed on a minimum of 50 nuclei per sample. (D) Model of the relationship between LADs, compartments, and gene release. In resting T cells, B2 and B3 subcompartments exist as LADs, while A2 subcompartment regions remain near to the lamina due to their LAD proximity along the chromosome. In contrast, the A1 and B1 compartments, being further from LADs along chromosomes, are distributed more distally in the nuclear interior (Fig. 6). Following T-cell activation, regions of LADs containing necessary gene or enhancer loci are released from the periphery, where they associate in the A2 compartment proximal to the lamina in a transcriptionally active state.