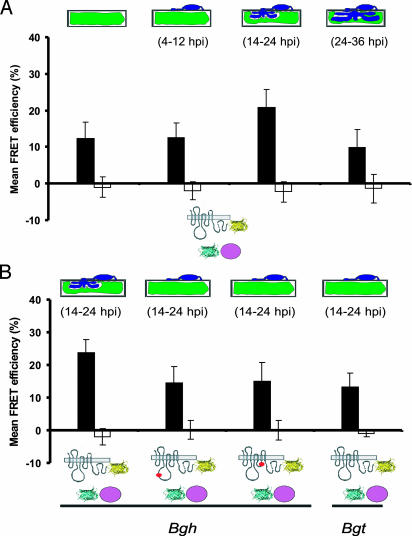
Fig. 4.
Whole-cell FRET efficiency between MLO and CaM increases coincident with pathogen entry. (A) Barley epidermal cells coexpressing MLO-YFP and CFP-CaM were challenged with Bgh conidia. FRET was quantified in nonchallenged cells (first column), 4–12 (second column), 14–24 (third column), and 24–36 (fourth column) hpi by using FRET-APB. (B) Barley epidermal cells coexpressing MLO-YFP and CFP-CaM were challenged with barley (Bgh) or wheat (Bgt) powdery mildew conidiospores. FRET was quantified by using APB at 14–24 hpi. In addition to wild-type MLO, single amino acid substitution mutants MLO-10 (second column) and MLO-29 (third column) were tested. Mean FRET efficiencies (black bars) and background FRET (white bars) ± SD from 50–100 sample sites are shown. The stage of fungal development is schematically depicted above the columns. MLO-YFP and CFP-CaM are schematically indicated below the graph as shown in Fig. 3D.

