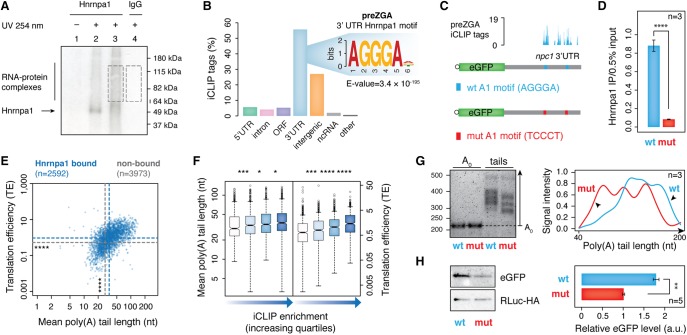
Figure 2.
Before ZGA, Hnrnpa1 regulates poly(A) tail length and translation of maternal mRNAs by binding 3′ UTRs. (A) Representative autoradiograph showing Hnrnpa1–RNA complexes immunopurified from zebrafish embryos at 2 hpf, resolved by SDS-PAGE and transferred to nitrocellulose. Lane 2: high RNase I treatment (1:50 dilution); lanes 1,3,4: low RNase I treatment (1:1000). RNA within the RNP complexes indicated by dashed boxes was purified and used for cDNA library preparation. (B) Bar plot displaying the proportion of Hnrnpa1 iCLIP tags in different genic and intergenic regions indicated below each bar. Inset shows significantly enriched hexanucleotide Hnrnpa1 binding motif in 3′ UTRs. (C) Schematic diagram of two constructs consisting of eGFP coding sequence and 1.1-kb-long 3′ UTR of an Hnrnpa1-bound mRNA (npc1) with either wild-type ([WT] blue) or mutated ([mut] red) Hnrnpa1 motif. Hnrnpa1 binding sites from iCLIP data are shown with blue bars above the npc1 3′ UTR annotation. (D) RT-qPCR on the α-Hnrnpa1 immunopurified RNA from UV-irradiated embryos, previously injected with mRNA reporters. The assay shows differential binding of Hnrnpa1 to the WT and mut reporter mRNAs in vivo. y-axis, the amount of immunopurified mRNA relative to 0.5% input; error bars represent SEM; n = 3. (****) P < 0.0001 (two-sided t-test). (E) Scatterplot showing mutual dependence of poly(A) tail length (x-axis) and TE (y-axis) for Hnrnpa1-bound maternal mRNAs. Blue and gray dashed lines refer to the median of poly(A) tail length and TE for Hnrnpa1-bound and nonbound transcripts, respectively: (****) P < 2.2 × 10⁻¹⁶ (Wilcoxon rank test). (F) Box plots showing the distribution of poly(A) tail length and TE of Hnrnpa1 targets with respect to the extent of Hnrnpa1 binding to maternal transcripts (iCLIP enrichment). Box plots refer to iCLIP enrichment quartiles in an increasing order for each mRNA feature, as shown by the blue-colored gradient arrows: (*) P < 0.05; (***) P < 0.001; (****) P < 0.0001 (Wilcoxon rank test). (G) 1.5% agarose gel (left) showing different poly(A) tail lengths of the WT and mut mRNA reporters at 64-cell stage measured by ePAT. The right panel represents the average distribution of poly(A) tail signal intensities from three independent biological replicates. (H) Western blots show RLuc-HA and eGFP protein levels from 64-cell stage embryos injected with WT and mut mRNA reporters. The adjacent bar plot presents quantification of eGFP levels normalized to the RLuc-HA expression (injection control). Error bars show SEM. Five embryos were loaded per lane (n = 5). (**) P < 0.01 (two-sided t-test).

