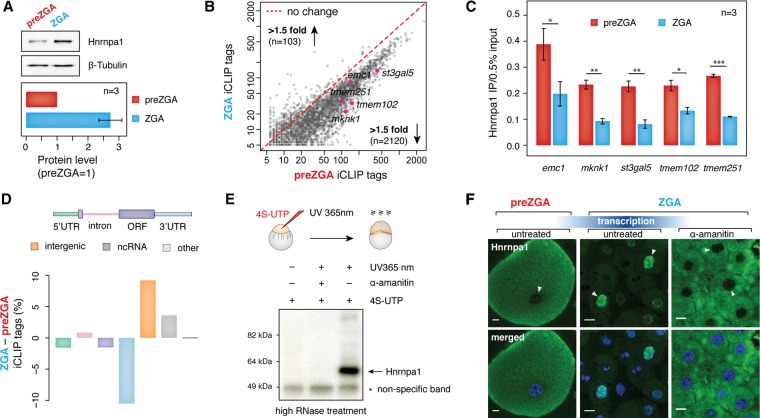
Figure 4.
Hnrnpa1 acquires different RNA-binding activities and localization at ZGA. (A) Western blots showing Hnrnpa1 expression level at 2 hpf (preZGA) and 3 hpf (ZGA). Beta-tubulin served as a loading control. A single embryo was loaded per lane. Bar plot displayed below shows quantified levels of Hnrnpa1 expression at the preZGA and ZGA stages. Hnrnpa1 expression at preZGA was set to 1. Error bar shows SEM; n = 3. (B) Scatterplot showing a decrease in the number of significant Hnrnpa1 iCLIP tags per mRNA at the ZGA stage. The number of iCLIP tags for the overlapping set of Hnrnpa1 mRNA targets was plotted (x-axis, ZGA stage; y-axis, preZGA stage). The number of genes with a <1.5-fold increase and decrease in Hnrnpa1 iCLIP tags at ZGA is indicated. Red dashed line refers to no change in the number of iCLIP tags between two developmental stages. mRNAs assayed in Figure 4C are highlighted in pink. (C) RT-qPCR on the RNA recovered from in vivo UV crosslinked and immunopurified Hnrnpa1-RNA complexes shows different levels of Hnrnpa1 binding to five endogenous maternal mRNAs at preZGA and ZGA: (y-axis) amount of immunopurified transcripts relative to 0.5% input; error bars represent SEM; n = 3. (D) Bar plot displaying global changes in the proportion of Hnrnpa1 iCLIP tags between preZGA and ZGA developmental stages. The color of each bar corresponds to the colored annotation above the bar plot. Negative and positive values on y axis indicate decrease and increase of the iCLIP tag percent in the respective regions at ZGA. (E) PAR-CLIP test showing Hnrnpa1 association with newly synthesized zygotic transcripts at ZGA. Presented autoradiograph shows the nitrocellulose membrane with immunopurified and radiolabeled zygotic RNA species in complex with Hnrnpa1 at 3 hpf. Note that the complexes were detected only in 4S-UTP-injected and UV365 nm-irradiated embryos. (F) Fluorescence microscopy images show a change of Hnrnpa1 subcellular localization during the zebrafish MZT. Immunostaining was performed on fixed embryos at the developmental stages indicated above the images. Nuclei were stained with Hoechst (blue) and Hnrnpa1 localization revealed by Alexa 488 dye (green). Transcription block was induced by microinjections of 0.4 ng α-amanitin into one-cell stage embryos. Nuclei are indicated with white arrowheads: (scale bars) 10 µm. Note the change in cell size due to the reductive cell divisions.

