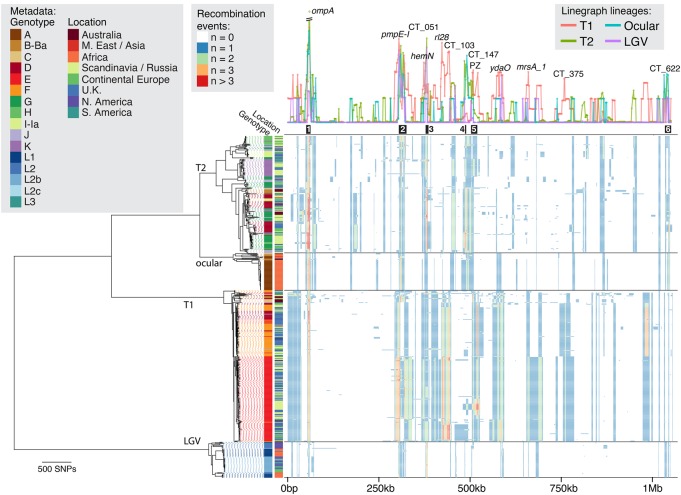
Figure 1.
Global phylogeny and recombination landscape of 563 C. trachomatis genomes. The phylogeny (left), with associated genotype and geographical data, is displayed alongside the linearized chromosome (right). Lineage labels are as per previous publications. Line graph (right, top) shows the number of recombination events affecting individual genes and are colored according to lineage. Black blocks below this graph show previously identified “hotspots” of recombination (Harris et al. 2012). Colored blocks (right, bottom) indicate inferred recombination events each affecting selected taxa and genomic location, with color indicating the number of inferred events. Gene annotations correspond to strain D/UW3. (PZ) Plasticity zone.

