Figure 3.
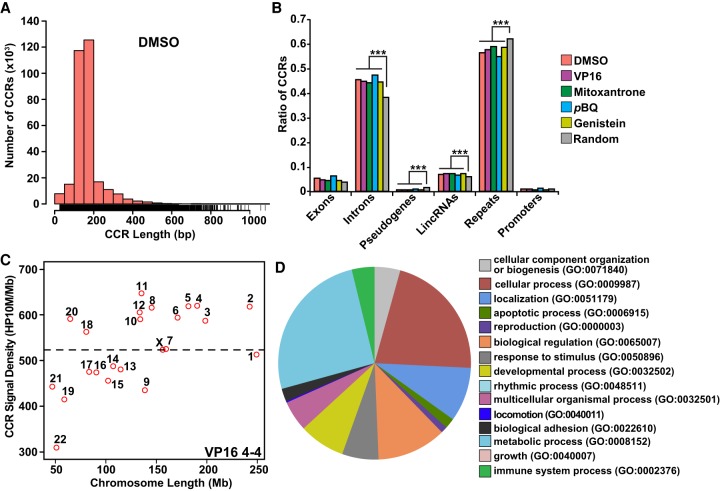
Characterization and functional analysis of TOP2A CCRs. (A) CCR length distribution. Bars represent numbers of CCRs in increasing 50-bp intervals of length. Note that most CCRs are 100–200 nt long. See also Supplemental Figure S6. (B) CCR occurrences in genomic elements compared with the control (10,000 random size-matched genome segments). Note enrichment in introns and lincRNAs; note underabundance in pseudogenes, repeats, and promoters. (***) P < 2.2 × 10⁻¹⁶; χ2 test. (A,B) Amplified samples; same treatments merged where applicable (Supplemental Table S1). (C) Scatterplot of TOP2A CCR signal density for each chromosome sorted by chromosome length with highest density on Chr 11. VP16 treatment shown as representative. Dashed line indicates average CCR signal density for all chromosomes. See also Supplemental Figure S7. (D) GO analysis of genes overlapping with TOP2A CCRs in union set of amplified DMSO-, VP16-, mitoxantrone-, pBQ-, and genistein-treated samples. GO term categories starting at the 12 o'clock position listed clockwise; metabolic process and cellular process are most enriched.

