Figure 2.
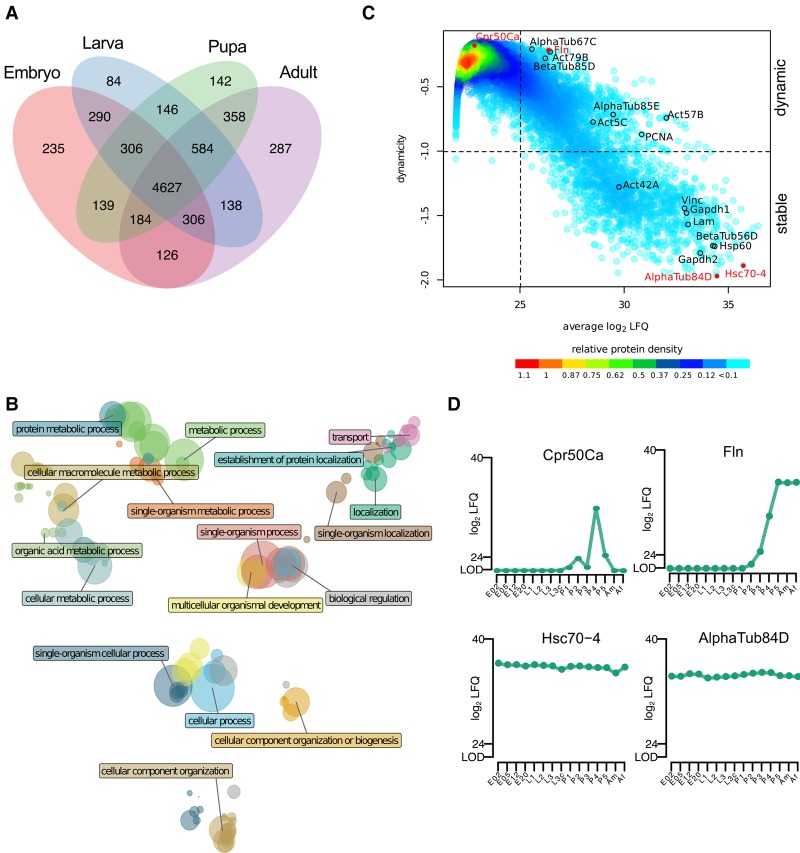
Characteristics of the developmental proteome. (A) Overlap of quantified protein groups between developmental stages results in a core proteome of 4627 proteins. (B) Clusters of enriched GO terms obtained from the core proteome are plotted in a coordinate system defined by the first two dimensions of a multidimensional scaling according to their similarity scores. The color of the circle represents the GO cluster with a representative term highlighted. The diameter of the circle is proportional to the size of the GO category. (C) The density plot relates protein abundance with a dynamicity score during developmental protein expression (log10 transformed Gini index). In the lower-right quadrant, highly stable proteins are represented, while the upper-right quadrant contains proteins with changing expression levels during development. (D) Expression profiles for two highly dynamic (upper panel) and two stably expressed (lower panel) proteins highlighted in red in the dynamicity plot.

