Figure 3.
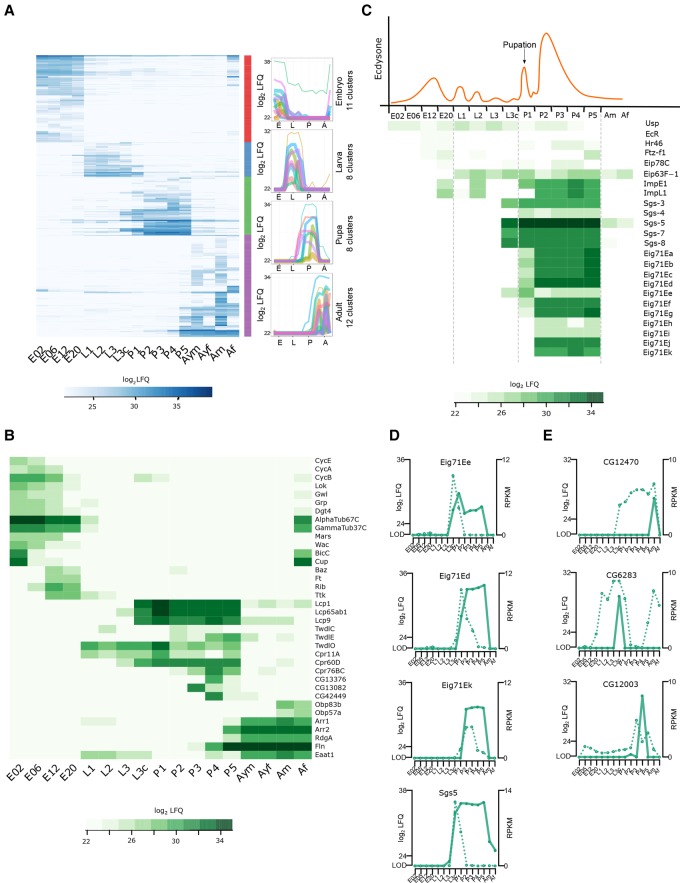
Stage-specific proteins and ecdysone-induced developmental regulation. (A) Heat map showing 1535 protein groups found to be differentially (ANOVA, FDR < 0.01) regulated during the life cycle. These protein groups were clustered into up to 12 stage-specific profiles. Average profiles of the individual clusters for each developmental stage are shown. (B) Heat map showing log2 LFQ abundance of proteins with stage-specific expression profiles discussed in the text. (C) Schematic representation of ecdysone pulses during fly development (upper panel) and heat map of log2 LFQ expression levels of selected proteins of 20-hydroxyecdysone regulated genes (lower panel). (D) For the Eig71E and Sgs gene family, RNA expression profiles (dotted line) differ from protein levels (solid line) during the pupal phase, demonstrating prolonged protein stability. (E) Three examples showing single protein expression burst, but more broadly detectable RNA indicating more tightly controlled protein expression.

