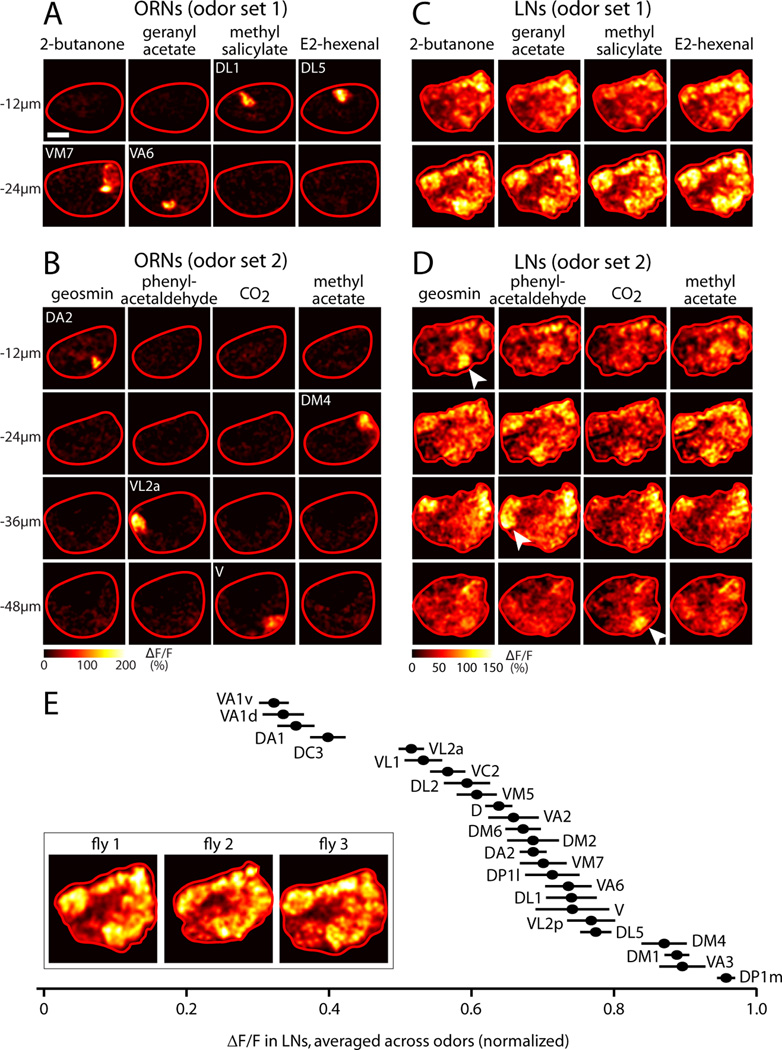
Figure 1. Activating a single glomerulus with odor recruits LN activity to all glomeruli.
(A) Two-photon imaging of odor-evoked calcium signals in ORN axon terminals. GCaMP3 is expressed in ORNs under the control of pebbled-Gal4. The antennal lobe is viewed from the dorsal side and outlined in red (anterior is down, medial is right). Scale bar, 20 µm. Odors were largely “private,” defined as activating only one ORN type. Odor set 1 is: 2-butanone, 5×10⁻⁶ (private for glomerulus VM7); geranyl acetate, 10−5 (VA6); methyl salicylate, 5×10⁻⁵ (DL1); E2-hexenal, 10−6 (DL5). Active glomeruli resided in two imaging planes, at −12µm (DL1 and DL5) and −24µm (VM7 and VA6).
(B) Same as (A) but for a different set of experiments using odor set 2: geosmin, 1% (DA2); phenylacetaldehyde, 10−5 (VL2a); CO2, 5% (V); methyl acetate, 10−5 (DM4). Active glomeruli resided in four different imaging planes (−12 µm, −24 µm, −36 µm, −48 µm).
(C–D) Same as (A–B), but for GABAergic LNs. GCaMP3 is expressed under the control of NP3056-Gal4, but similar results were seen for GH298-Gal4 (Figure S1). Activating individual glomeruli elicits a global pattern of LN activity. Imaging planes are selected to match the planes containing the glomeruli directly excited by these sets of odors, but similar results are seen in all planes. Note that three of the private odors in set 2 recruit extra LN activity in their cognate glomerulus (white arrowheads).
(E) The spatial pattern of LN activity is similar across individuals. Images were averaged across odors within each experiment, and LN activity was quantified in glomeruli that could be identified with confidence. The value for each glomerulus was normalized to the maximum glomerulus in that brain (n= 6–19 experiments, mean ± SEM). Across individuals, a given glomerulus exhibits a characteristic level of LN activity (one-way ANOVA, p=10−85). Inset shows odoraveraged activity for three individual flies (GCaMP expressed under the control of NP3056 for fly 1, GH298 for flies 2 and 3); see Figure S1 for glomerular boundaries in this plane.

