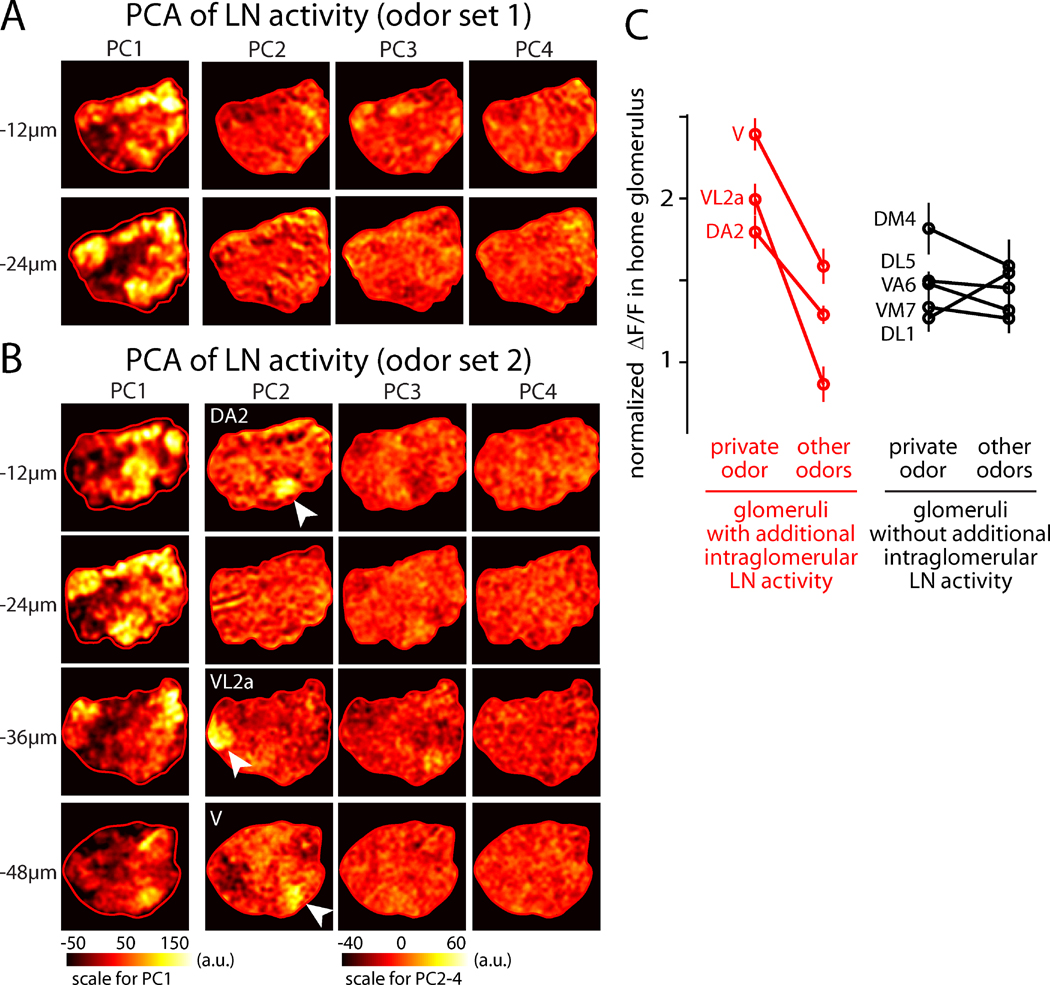
Figure 2. Activation of some glomeruli recruits intraglomerular LN activity in addition to the global pattern of LN activity.
(A) Principal components of the LN activity patterns from Figure 1C (odor set 1). The input to each PCA is a set of four images, one for each of the four odors in the stimulus set. The output of the analysis is therefore four principal components (PCs). Overall, odor responses (in Figure 1C) resemble a scaled version of the first principal component (PC1). PCA was computed separately within each imaging plane and was applied only to the pixels contained in the antennal lobe (red ROI). Note the different color scale for PC1 compared to PC2–PC4.
(B) Same as above but for odor set 2. Overall, odor responses (in Figure 1D) resemble a scaled version of PC1. In addition, some odors in this set evoke additional activity in their cognate glomerulus (geosmin, phenylacetaldehyde, CO2), and thus their cognate glomerulus appears as PC2 in the corresponding imaging plane (DA2 for geosmin, VL2a for phenylacetaldehyde, V for CO2). In the three imaging planes where these three glomeruli reside, they are indicated by arrowheads. The spatial structure of PC2 is reproducible across experiments (n=6–8 for odor set 2).
(C) LN activity in each of the eight glomeruli corresponding to our eight private odors. For each data point, ΔF/F was measured in one glomerulus and then normalized to the average measured across the entire antennal lobe (mean of 6–13 experiments, ± SEM). For each glomerulus, the amount of activity elicited by its private odor was compared to the average activity elicited by the other three odors used in that experiment. For three glomeruli, there was a significant difference between the private odor and other odors (DA2, VL2a, V; p=0.003–0.01, p-values are Bonferroni-corrected for multiple comparisons). These were also the glomeruli which emerged as principal components in PCA (A–B). For the other glomeruli, there was no significant difference.

