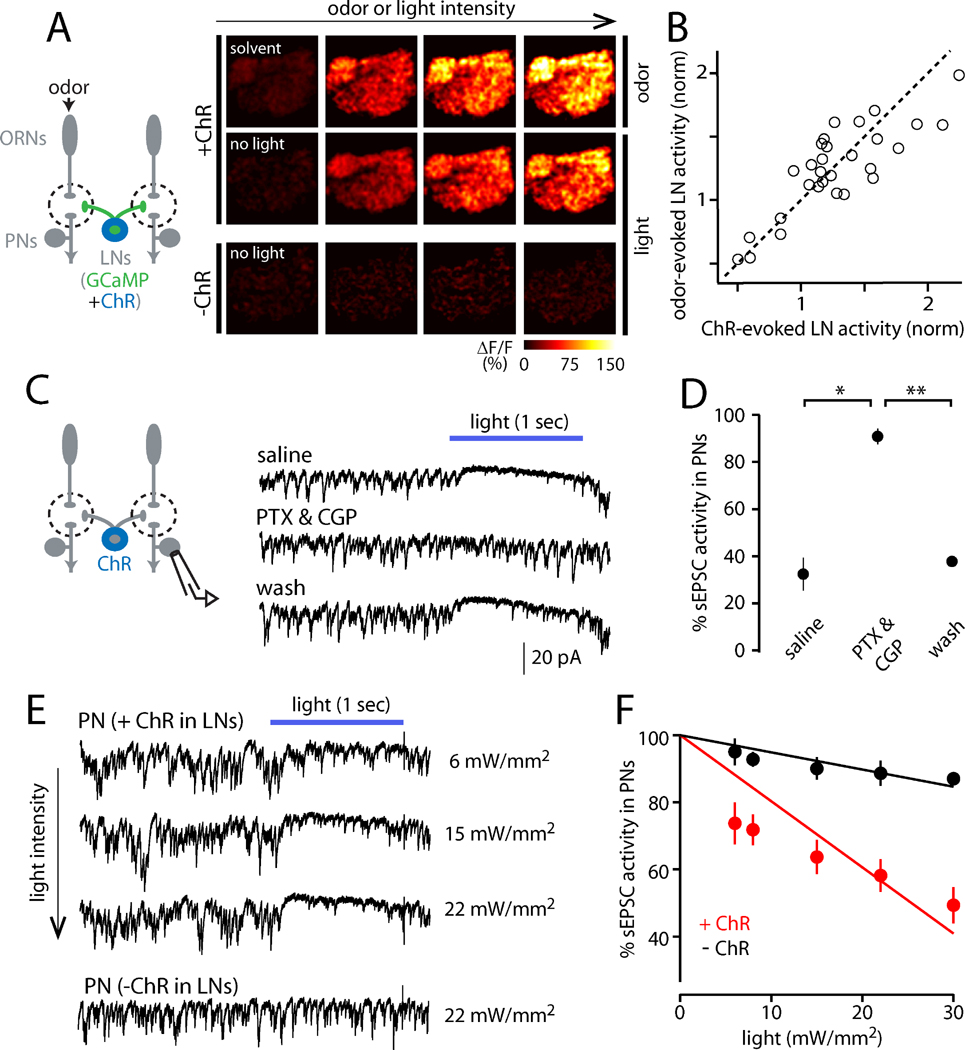
Figure 4. Optogenetic stimulation of LNs to measure PN sensitivity to inhibition.
(A) Both GCaMP3 and channelrhodopsin-2 (ChR) were expressed in LNs. LNs were excited using either odor or light in the same brain. LN activity increases with increasing levels of odor (2-butanone) or light (470 nm). There were no light-evoked calcium signals without ChR (bottom).
(B) Each symbol compares the amount of LN activity evoked by odor versus light in a glomerulus in the same experiment (n=40 data points in 5 brains). Activity is normalized to the average amount of activity in the antennal lobe elicited by the respective stimulus. The dotted line is unity. The correlation between odor- and light-evoked activity is strong and significant (R2=0.80, p=10−14), meaning the two methods produce the same spatial pattern.
(C) ChR-expressing LNs were excited using light while sEPSCs were recorded from a PN. Optogenetic excitation of LNs suppresses sEPSCs, and this effect is reversibly blocked by GABAA and GABAB receptor antagonists (5 µM picrotoxin and 50 µM CGP54626; light is 488 nm, 22 mW/mm2).
(D) The effect of LN activity on sEPSCs is significantly different in GABA receptor antagonists than in saline or wash (*p=0.006, **p=0.002; paired t-tests, n=3). Open circles are individual cells; filled circles are mean ± SEM.
(E) Increasing light intensity produces increasing suppression of sEPSCs in a recording where LNs express ChR. Light has minimal effect without ChR (bottom row).
(F) Percent sEPSC activity versus light intensity for a representative cell from each genotype. This metric can range from 0 (full suppression) to 100 (no suppression); see Supplementary Experimental Procedures for details. Lines are fits constrained to intersect the y-axis at 100. Across a test set of PNs, the slopes of the fitted lines were significantly different between ChR-expressing and control flies (n=8 and 5, respectively, p=2×10⁻⁴, unpaired t-test, data not shown).

