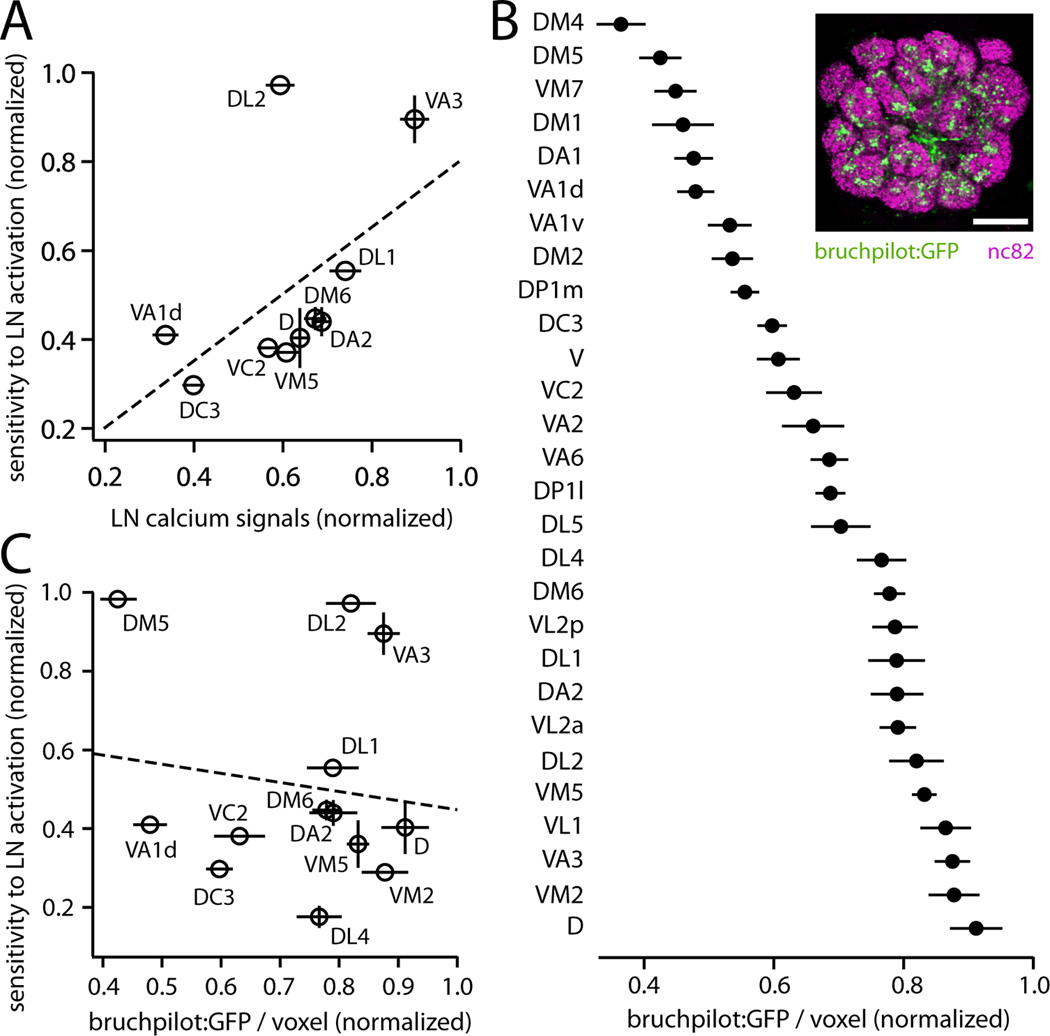
Figure 6. The density of LN release sites does not predict sensitivity to LN activation.
(A) Sensitivity to LN activation is not significantly correlated with LN calcium signals (R2=0.28, p=0.12).
(B) Inset: single confocal section through the antennal lobe of a fly expressing a marker of presynaptic release sites (bruchpilot:GFP) in a large subset of LNs under the control of NP3056-Gal4. Neuropil is immunostained (nc82 Ab) to visualize glomerular boundaries. Scale bar, 20 µm. Graph shows measurements of bruchpilot:GFP signal per unit glomerular volume, normalized within each brain to the glomerulus with the highest value. Data are the mean of 6 measurements, ± SEM. The density of bruchpilot:GFP varies significantly across glomeruli (one-way ANOVA, p=10−36). Similar results were observed with two other markers of LN morphology (Figure S4).
(C) Sensitivity to LN activation (data from Figure 5C) is not correlated with the density of LN release sites (R2 = 0.02, p = 0.67, permutation test).

