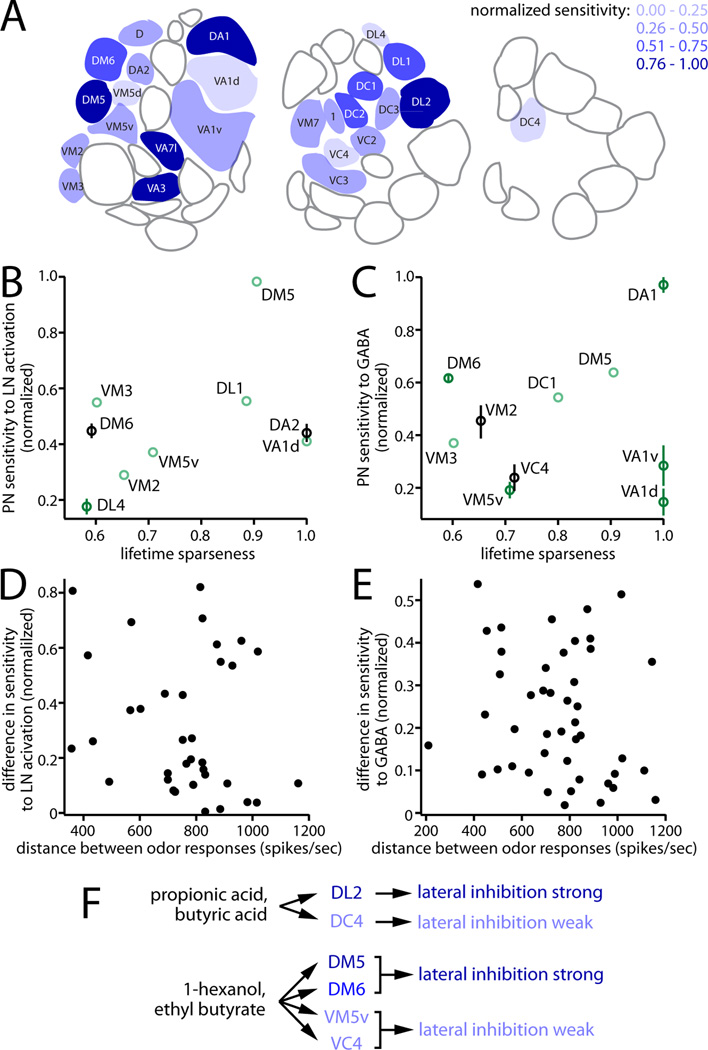
Figure 9. Sensitivity to inhibition is orthogonal to odor tuning.
(A) Schematic showing three sections through the antennal lobe, from anterior (left) to posterior (right). Glomeruli are color coded according to their sensitivity to LN activation and/or GABA, with dark blue being the most sensitive and light blue the least sensitive. White glomeruli were not sampled.
(B) For each glomerulus, sensitivity to LN activation is plotted against the odor selectivity of its cognate odorant receptor, quantified as lifetime sparseness (0, nonselective; 1, maximally selective). There is no significant correlation (R2=0.17, p=0.27). Light green points are singly sampled; dark green points are sampled 2 – 4 times; black points are sampled at least 5 times. All p-values were determined by a permutation analysis (see Supplemental Experimental Procedures).
(C) Same as (B), but for sensitivity to GABA (R2=0.02, p=0.71).
(D) Difference in sensitivity to LN activation versus the Euclidean distance between ORN response profiles, for every pairwise combination of sampled glomeruli (R2=0.04, p=0.26).
(E) Same as (D), but for sensitivity to GABA (R2=0.03, p=0.26).
(F) Odors are simultaneously encoded by glomeruli subject to strong lateral inhibition, and other glomeruli subject to weak lateral inhibition.

