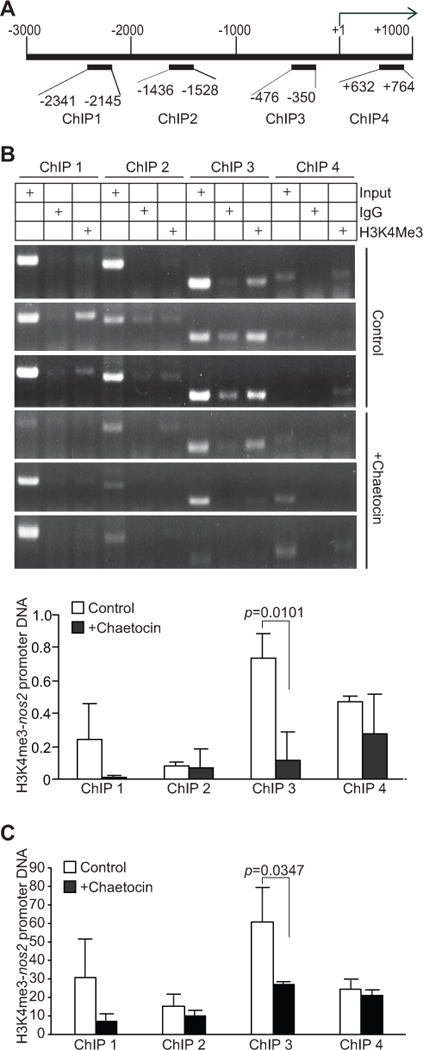
Figure 7. Inhibition of SETD1B significantly decreases H3K4me3 level at the nos2 promoter region in tumor-induced MDSCs in vivo.

A. Structure of the nos2 promoter region. The number above the bar indicates nucleotide locations relative to the nos2 transcription initiation site. The ChIP PCR primer regions are also indicated. B. CD11b+Gr1+ cells from control (n=3) and chaetocin-treated (n=3) 4T1 tumor-bearing mice were analyzed by ChIP using IgG control antibody and H3K4me3-specific antibody, respectively, followed by PCR analysis with nos2 promoter specific PCR primers as shown in A. Input DNA was used as an normalization control. The intensities of H3K4me3 ChIP, IgG ChIP, and input PCR bands as shown in B were quantified using Image J. The IgG background was subtracted from the H3K4me3 band intensities, which was then normalized to the respective input band intensities and presented at the bottom panel. C. In a separate experiment, CD11b+Gr1+ cells from control (n=3) and chaetocin-treated (n=3) tumor-bearing mice were analyzed by ChIP anti-H3K4me3-specific antibody. The immunoprecipitated DNA was then analyzed by qPCR in triplicates. The IgG background was subtracted from H3K4me3-DNA level. The input of each ChIP primer set was arbitrarily set at 1 and the H3K4me3 was normalized to input DNA level. Column: average of 3 mice. Bar: SD.
