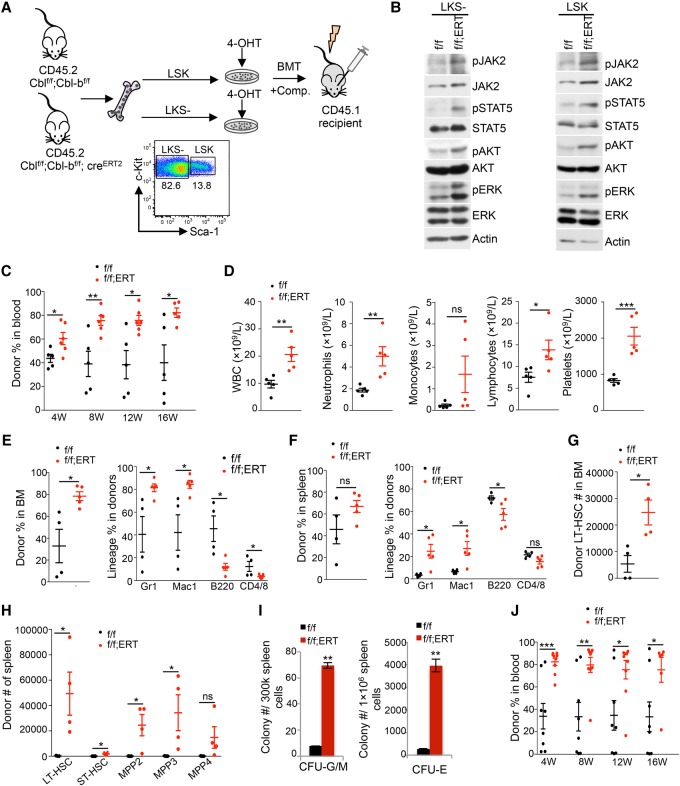
Figure 4.
Cbl−/−;Cbl-b−/− HSPCs show increased JAK2 protein level, signaling, and reconstituting ability and give rise to CMML-like myeloid malignancies. (A) Experimental scheme of in vitro excision of Cbl/Cbl-b followed by Western blot or BM transplantation (BMT). Sorted LSK or LKS− cells from Cblf/f;Cbl-bf/f (f/f) or Cblf/f;Cbl-bf/f;CreERT2 (f/f;ERT) mice were cultured in 4-OHT-containing medium for 2 d. Resultant cells from 2000 LSKs after culture were injected into each recipient along with competitors. (B) Two days after culture in 4-OHT, LSK or LKS− cells were analyzed for JAK2 level and signaling by Western blot. (C) Donor chimerisms in the peripheral blood of Cblf/f;Cbl-bf/f and Cblf/f;Cbl-bf/f;CreERT2 LSK transplanted mice were measured at 4, 8, 12, and 16 wk. (D) Complete blood count (CBC) analysis of peripheral blood of Cblf/f;Cbl-bf/f and Cblf/f;Cbl-bf/f;CreERT2 LSK transplanted mice at 12 wk after transplantation. (E,F) The left panels show the donor percentages in the BM (E) or spleens (F) of Cblf/f;Cbl-bf/f and Cblf/f;Cbl-bf/f;CreERT2 LSK transplanted mice 16 wk after transplantation. The right panels show lineage distribution within the donor fraction in the BM (E) or spleens (F). (G) The numbers of donor-derived long-term HSCs (LT-HSCs) in the BM of Cblf/f;Cbl-bf/f and Cblf/f;Cbl-bf/f;CreERT2 LSK transplanted mice 16 wk after transplantation are shown. (H) The numbers of donor-derived LT-HSC, short-term HSC (ST-HSC), and various multipotent progenitor (MPP) populations in the spleens of Cblf/f;Cbl-bf/f and Cblf/f;Cbl-bf/f;CreERT2 LSK transplanted mice 16 wk after transplantation are shown. (I) Colony-forming unit (CFU)-GM (left) or CFU-E (right) progenitors in the spleens of Cblf/f;Cbl-bf/f and Cblf/f;Cbl-bf/f;CreERT2 LSK transplanted mice are shown. (J) BM cells from Cblf/f;Cbl-bf/f and Cblf/f;Cbl-bf/f;CreERT2 LSK transplanted mice were injected into secondary recipients. Donor chimerisms in the peripheral blood of recipient mice were measured at 4, 8, 12, and 16 wk. Each symbol represents an individual mouse. Horizontal lines indicate mean frequencies. Error bars indicate SE. (*) P < 0.05; (**) P < 0.01; (***) P < 0.001; (ns) not significant.

