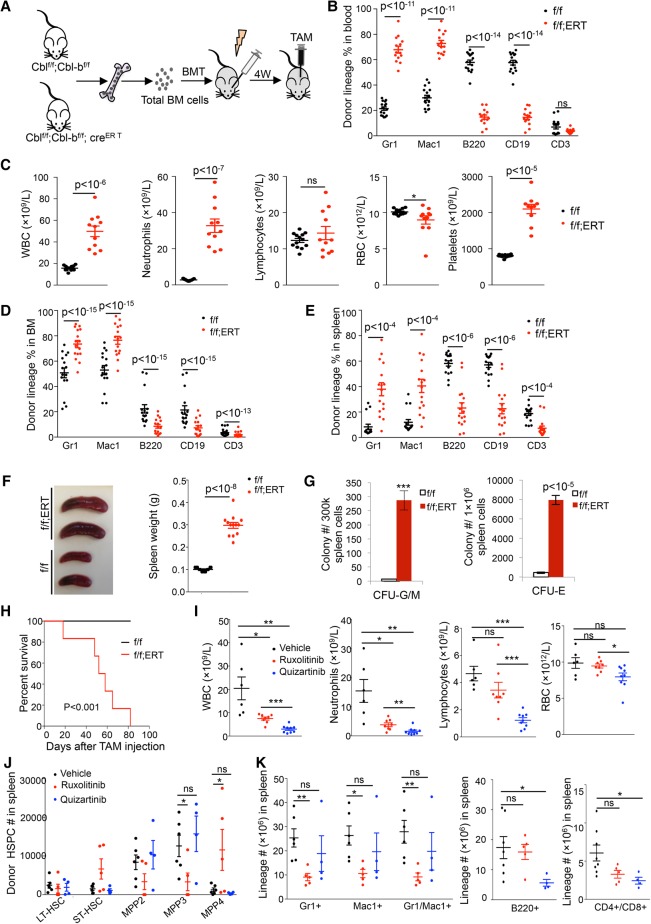
Figure 5.
JAKi blunts CMML development in Cbl;Cbl-b−/− transplanted mice. (A) Experimental scheme of in vivo excision of Cbl and Cbl-b in transplanted mice. Two million total BM cells from Cblf/f;Cbl-bf/f (f/f) or Cblf/f;Cbl-bf/f;CreERT2 (f/f;ERT) mice were injected into lethally irradiated recipient mice. Four weeks after transplantation, mice were treated with TAM. (B) Donor percentages in different blood lineages in Cblf/f;Cbl-bf/f and Cblf/f;Cbl-bf/f;CreERT2 transplanted mice were analyzed by flow cytometry 45 d after TAM administration. (C) CBC analysis of Cblf/f;Cbl-bf/f and Cblf/f;Cbl-bf/f;CreERT2 transplanted mice 45 d after TAM. (D,E) Donor percentages in different lineages in the BM (D) or spleens (E) from Cblf/f;Cbl-bf/f and Cblf/f;Cbl-bf/f;CreERT2 transplanted mice 20–65 d after TAM injection. (F) The left panel shows representative images of spleens from Cblf/f;Cbl-bf/f and Cblf/f;Cbl-bf/f;CreERT2 transplanted mice after TAM injection. The right graph shows spleen weights. (G) CFU-G/M (left) or CFU-E (right) progenitors in the spleens of Cblf/f;Cbl-bf/f and Cblf/f;Cbl-bf/f;CreERT2 transplanted mice after TAM injection are shown. n = 9. (H) A Kaplan-Meier survival curve of Cblf/f;Cbl-bf/f (n = 20) and Cblf/f;Cbl-bf/f;CreERT2 (n = 19) transplanted mice after TAM injection is shown. P-value was calculated by log-rank t-test. (I) BM cells from Cblf/f;Cbl-bf/f;CreERT2 transplanted mice were injected into cohorts of recipients. Secondarily transplanted mice were subjected to either vehicle, ruxolitinib, or quizartinib treatment. CBC analyses 6 wk after drug treatment are shown. (J) The numbers of various donor-derived HSPC populations in the spleens of Cblf/f;Cbl-bf/f;CreERT2 transplanted mice with different drug treatments are shown. (K) Cell numbers of myeloid and lymphoid lineages in the spleens of drug-treated mice were quantified by cell count and flow cytometry. Each symbol represents an individual mouse. Horizontal lines indicate mean frequencies. Error bars indicate SE. (*) P < 0.05; (**) P < 0.01; (***) P < 0.001; (ns) not significant.

