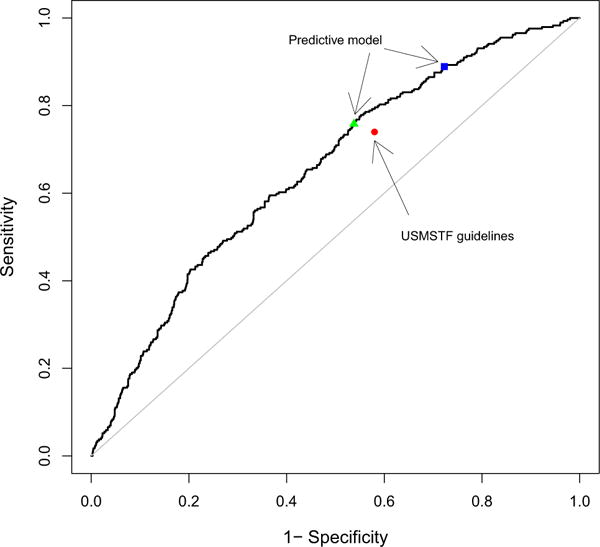
Fig. 1.

ROC curve for the predictive model using validation data. This graph demonstrates the potential advantage of using a continuous predictive model for risk stratification. Cut-points for probability of metachronous advanced neoplasia, which were estimated by the predictive model, can be identified to improve either sensitivity or specificity over the USMSTF guidelines. The red dot represents the sensitivity and specificity estimated by the USMSTF guidelines in the validation data. The blue square represents the estimated sensitivity and specificity in the validation data corresponding to the cut-point targeted for improved sensitivity over USMSTF guidelines. The green triangle represents the estimated sensitivity and specificity in the validation data corresponding to the cut-point identified in the test data targeted to improve specificity over the USMSTF guidelines. (Color figure online)
