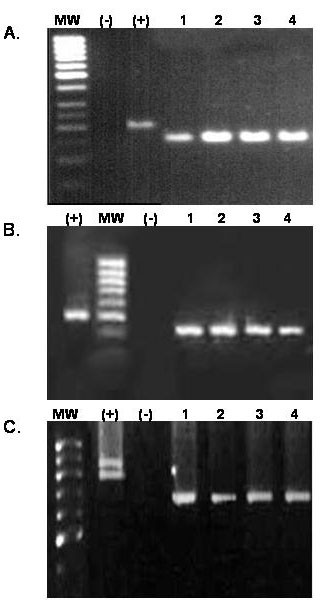
Figure 2.

Agarose gel electrophoresis showing the size of the amplified products of the genes MSP-1 (panel A), MSP-2 (panel B) and GLURP (panel C). MW represents the molecular weight marker,(-) a negative control and (+) a positive control. The numbers are equivalent to the case number. Panel A corresponds to allelic family MAD-20 of MSP-1 showing amplification products of ~150 bp in the cases, panel B corresponds to allelic family IC50 showing amplification products of ~450 bp in the cases, panel C corresponds to GLURP showing amplification products of ~700 bp in the cases.
