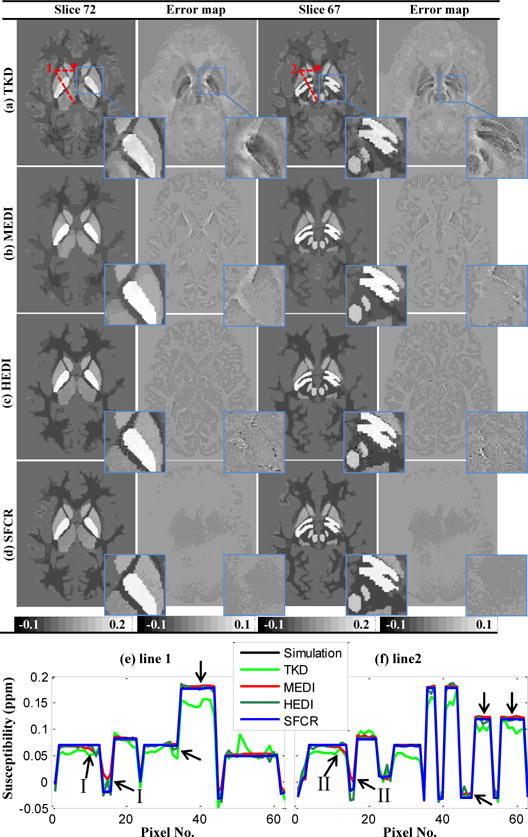
Fig. 3.

Comparison on susceptibility maps reconstructed by TKD (a), MEDI (b), HEDI (c) and SFCR (d) of the simulation data of two slices and their error maps with zoomed views in blue rectangles. The error maps of MEDI and HEDI present obvious residual structures, while there is no noticeable error in SFCR results. (e-f) susceptibility profiles of line 1 and line 2 with • denoting the starting point, where arrows indicate profile differences of MEDI and HEDI.
