
Fig. 7.
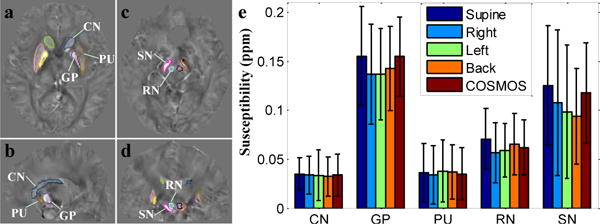
(a–d) ROI contours of three dimensional volumes; (e) bar graph compares the mean susceptibilities and standard deviations of ROIs in deep gray matter between four orientations reconstructed by SFCR and COSMOS, with supine position is the closest to COSMOS.