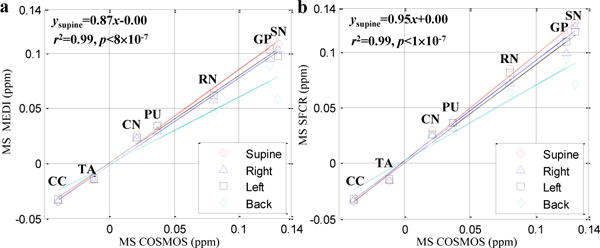
Fig. 8.

Correlation of inter-subject averaged susceptibility values (MS) measured in the selected brain regions using MEDI (a) and SFCR (b) methods with those using COSMOS. The line regression parameters of the supine position are noted on the top left of each figure.
