
Figure 7.
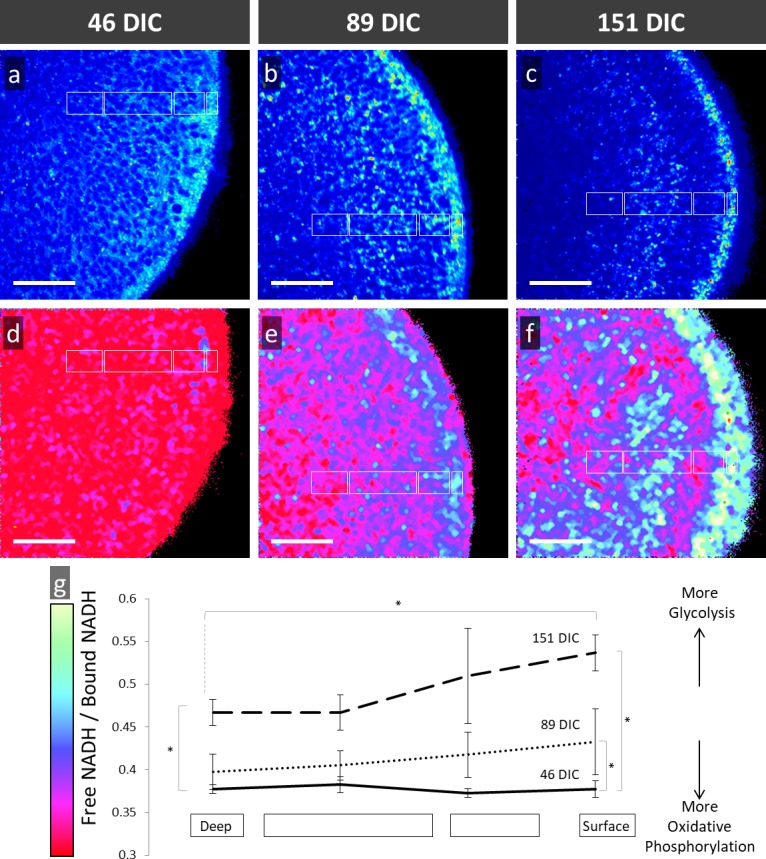
FLIM analysis of hESC-derived retinal organoids at (A, D) 46 DIC, (B, E) 89 DIC, and (C, F) 151 DIC imaged by 2-photon autofluorescence microscopy and then assessed using phasor analysis of fluorescent lifetimes for NADH. (A–C) Autofluorescent images and (D–F) pseudocolor-rendered images based on color coding from the phasor histograms demonstrates metabolic progression from a uniform lifetime signature to a lamellar structure. (G) Quantitative analysis of free/bound NADH at different surface levels and ages with error bars representing standard deviation. Asterisks, time points and relative depth of regions sampled with statistically significant difference in free/bound NADH. Scale bars: 50 μm.