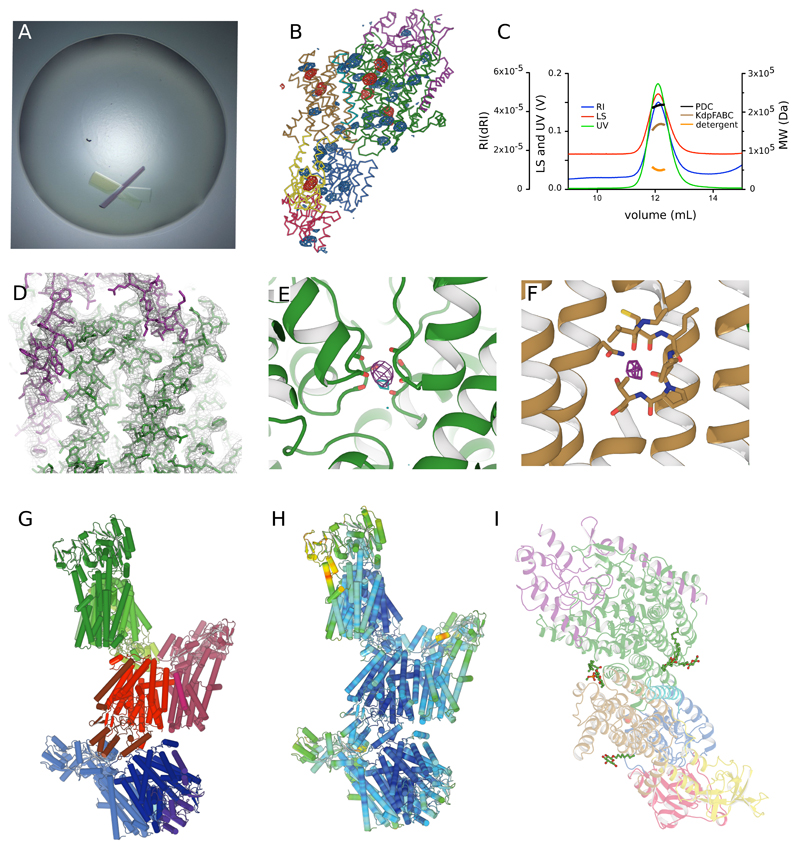
Extended Data Figure 1. Structure Determination.
(A) Crystals had plate-like morphology with a significant level of birefringence. (B) Anomalous density maps from Hg (red mesh at 5σ) and Seleno-methionine (blue mesh at 3 σ) were used to identify positions of cysteine and methionine residues, respectively. This image shows one of the three KdpFABC complexes in the asymmetric unit with the locations of seven Hg atoms and 44 Se atoms superimposed on the ribbon model of the KdpFABC complex (colors identified in Fig. 1). Considering all three complexes in the asymmetric unit, we were able to identify a total of 21 Hg sites and 132 Se sites, which were a powerful constraint for building the model prior to refinement. (C) Elution profiles from size-exclusion chromatography using multiple detectors to quantify the size of the complex. Traces are shown for multiple angle laser light scattering (LS), for refractive index (RI) and for absorption at 280 nm (UV). Based on these data, sizes of the protein-detergent complex (PDC), of the KdpFABC complex and of the detergent micelle have been determined. Given the expected Mr of 160 kD, this data is consistent with a monomeric KdpFABC complex. (D) 2mFo-DFc map densities at 1.5σ are superimposed with the refined model at 2.9 Å resolution in order to demonstrate the quality of the fit. The green chain corresponds to the N-terminus of KdpA (upper right corner) and helices from the second M1PM2 repeat. The purple chain corresponds to the transmembrane domain of KdpC (far left) and part of the periplasmic domain (top). A series of bulky aromatic residues toward the periplasmic side of the KdpC helix unambiguously establishes its orientation in the membrane. (E) mFo-DFc difference density (purple at 6.5σ) was present in the S3 site of the KdpA selectivity filter. The anomalous signal from K (cyan at 3.8σ) is consistent with the presence of a K+ ion at this site. (F) mFo-DFc difference density (purple at 4.5σ) next to the unwound portion of M4 in KdpB was consistent with the presence of a water molecule at this canonical ion binding site in P-type ATPases. No anomalous signal from K was seen at this site. (G) Three KdpFABC complexes compose the asymmetric unit and are colored in shades of red, green and blue. Intermolecular contacts can be seen between the periplasmic domain of KdpC and the cytoplasmic face of KdpA. At the current resolution, the three complexes have an identical structure. Although previous results suggest that KdpFABC forms a dimer51–53, we did not observe dimer formation either during purification or within our crystal lattice. This result suggests that dimerization may depend on specific conditions, such as the choice of detergent or the presence of a lipid bilayer. (H) The three complexes have been colored according to the temperature factor using a standard color palette moving from blue (lowest B factor) to red (highest B factor). KdpA appears to be the best ordered and peripheral regions of the N- and A-domains display the most flexibility. (I) In addition to the four protein subunits, two detergent molecules (OG) and two lipid molecules (DMPC) were modeled into densities at the periphery of the structure for each complex.

