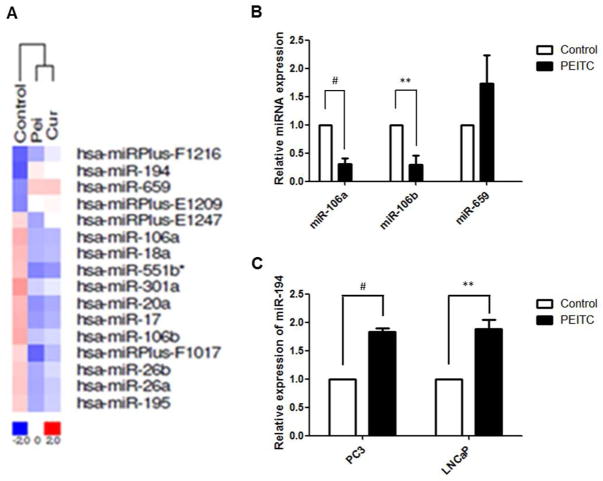
Figure 1. PEITC alters the miRNA profile in PCa cells.
A) Hierarchical cluster analysis relative to the expression profiles of miRNAs in untreated group and cells treated with either PEITC or curcumin. miRNA expression intensity is represented according to a color scale ranging between blue (low) and red (high), only the most altered miRNAs are shown with their names; B) qPCR validation of miR106a, miR106b, miR-659 levels in LNCaP cells treated by PEITC; C) PEITC induces miR-194 levels in both LNCaP and PC3 cells.

