Figure 2.

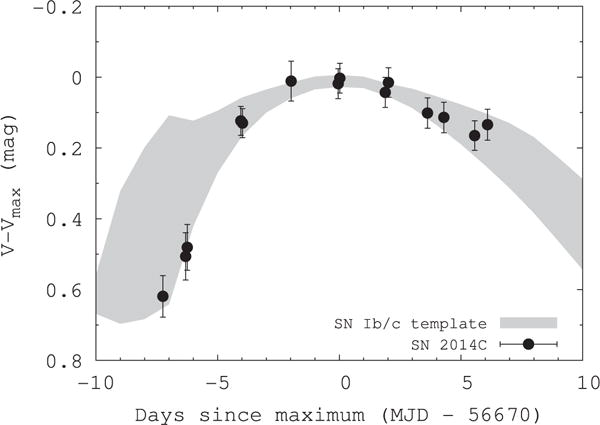
Temporal evolution of the v-band emission from SN 2014C as observed by Swift-UVOT, compared to the SNe Ib/c template from Drout et al. (2011). The width of the gray curve is derived from the 1σ deviation from the mean at each epoch.

Temporal evolution of the v-band emission from SN 2014C as observed by Swift-UVOT, compared to the SNe Ib/c template from Drout et al. (2011). The width of the gray curve is derived from the 1σ deviation from the mean at each epoch.