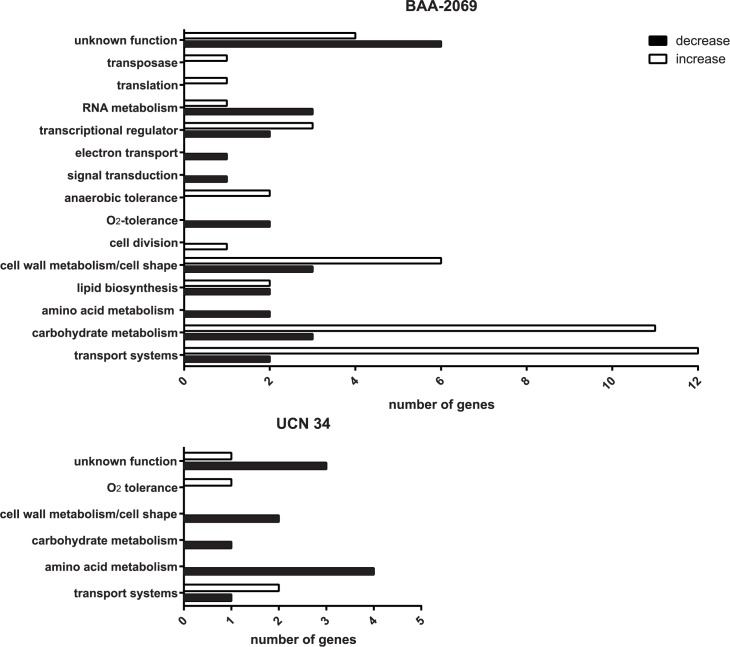
Fig 3. The number of regulated genes found by microarray analysis.
The genes whose expression were increased (white) or decreased (black) after phagocytosis (0 h and 5 h together) compared to -1 h (attachment of bacteria) are represented. The number of genes which were regulated in the S. gallolyticus subsp. gallolyticus strains BAA-2069 and UCN34 through phagocytic uptake by THP-1 macrophages are displayed on the x-axis. The functional categories in which the genes are sorted are displayed on the y-axis.

