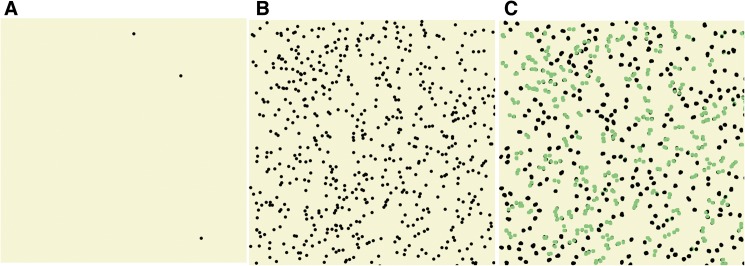
Fig 1. Representation of an “over-head” view of receptor density and associations.
Each “dot” represents the radius of gyration of a surface IgE molecule. Panel A; density of 5000/cell. Panel B; density of 500,000/cell. Panel C; density of 500,000/cell where green dots represent IgE-FceRI molecules in close enough proximity to be considered a potentially functional aggregate based on published studies.

