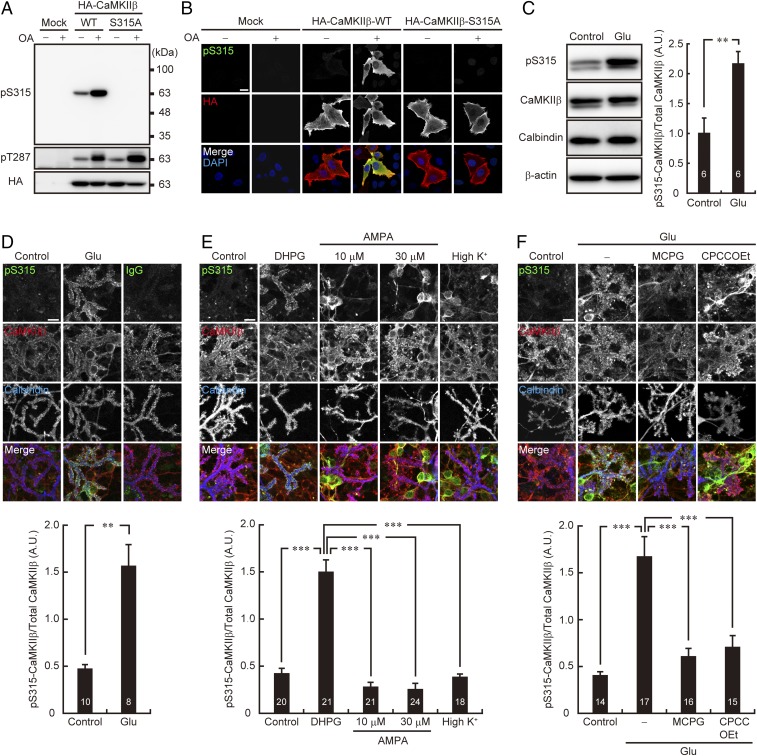
Fig. 2.
Synaptic activity increases CaMKIIβ phosphorylation at S315 in Purkinje cells via group I mGluR signaling. (A and B) The specificity of the phospho-S315 (pS315) CaMKIIβ antibody. WT and S315A mutant form of HA-tagged CaMKIIβ overexpressed in HeLa cells were subjected to immunoblotting (A) or immunocytochemical analysis (B) with the indicated antibodies. OA: 1 μM okadaic acid treatment for 30 min. (Scale bar, 20 μm.) (C) CaMKIIβ phosphorylation at S315 in cultured cerebellar cells before (Control) and after (Glu) 10 μM glutamate stimulation for 10 min. The treated cells were subjected to immunoblot analysis with indicated antibodies (Left). Band intensities of CaMKIIβ phosphorylated at S315 (pS315) and total CaMKIIβ were quantified, and the phosphorylation level was calculated by dividing the band intensity of pS315-CaMKIIβ by that of total CaMKIIβ (Right). **P < 0.01, Student’s t test. (D–F) Immunocytochemistry of CaMKIIβ phosphorylation at S315 in cultured Purkinje cells upon pharmacological stimulation of synaptic activity. Primary cultured cerebellar cells were treated with 10 μM glutamate (Glu) for 10 min (D), 100 μM DHPG, or 10 or 30 μM AMPA for 10 min, or 55 mM KCl (high K+) for 2 min (E), and 10 μM Glu for 10 min in the presence or absence of 1 mM MCPG or 100 μM CPCCOEt (F). The treated cells were immunostained with the indicated antibodies. Purkinje cell distal dendritic areas are shown. (Scale bars, 10 μm.) Quantification of the phosphorylation level of CaMKIIβ at S315 in Purkinje cells is shown (Lower). Fluorescent intensities of CaMKIIβ phosphorylated at S315 (pS315) and total CaMKIIβ in the distal dendritic area of Purkinje cells identified with Calbindin staining were quantified, and the phosphorylation level was calculated by dividing the immunoreactivity of pS315-CaMKIIβ by that of total CaMKIIβ. (D) **P < 0.01, Mann–Whitney U test. (E) ***P < 0.0001, one-way ANOVA with Bonferroni’s test for multiple comparisons. (F) ***P < 0.0001, one-way ANOVA with Bonferroni’s test for multiple comparisons. The numbers of experiments (C) or neurons (D–F) are indicated in each graph.

