Fig. S2.
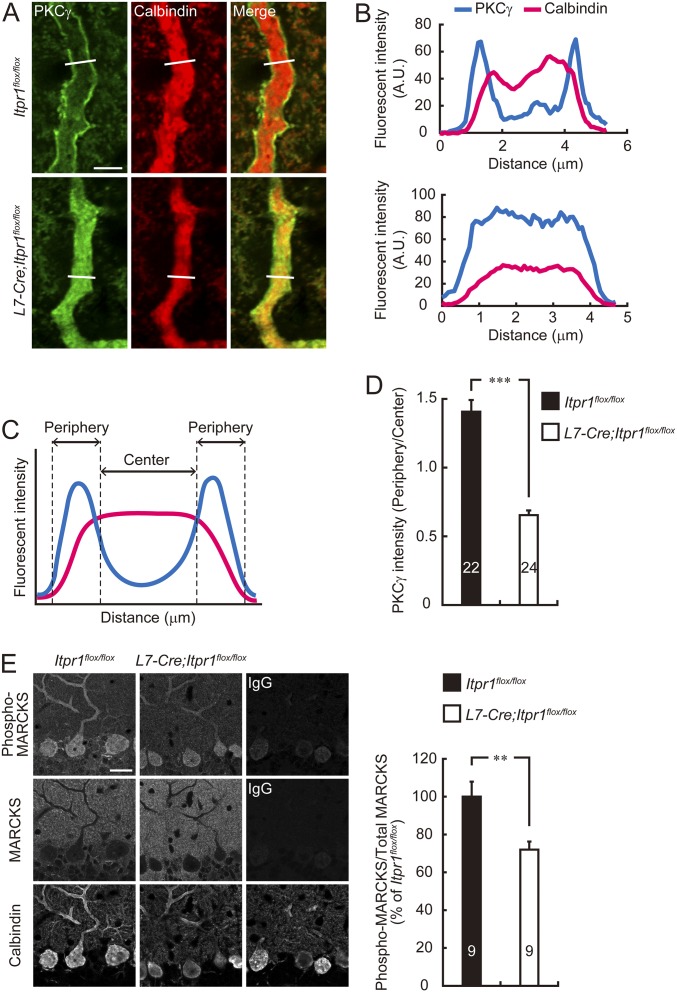
PKC activation is impaired in IP3R1-deficient Purkinje cells. (A) Immunohistochemical analysis for subcellular localization of PKCγ in Itpr1flox/flox and L7-Cre;Itpr1flox/flox Purkinje cells. Sagittal sections of cerebellum prepared from adult Itpr1flox/flox (Upper) and L7-Cre;Itpr1flox/flox (Lower) mice were stained with anti-PKCγ and anti-calbindin antibodies. Purkinje cell dendrites are shown. (Scale bar, 5 μm.) (B) Plot profile of fluorescent intensity in the white line shown in A. (Upper) Itpr1flox/flox. (Lower) L7-Cre;Itpr1flox/flox dendrite. (C) Quantitative analysis of the membrane localization of PKCγ. To quantify the membrane localization of PKCγ, the diameter of dendrites was divided into four equal regions, and then the ratio of PKCγ fluorescence intensity in the periphery (two outer quartiles) to center (two inner quartiles) was calculated. (D) PKCγ fluorescent intensity ratio of peripheral quarters to center quarters in Purkinje cell dendrites are shown. ***P < 0.0001, Mann–Whitney U test. (E) Immunohistochemical analysis for MARCKS phosphorylation in Itpr1flox/flox and L7-Cre;Itpr1flox/flox Purkinje cells. Sagittal sections of cerebellum prepared from adult Itpr1flox/flox and L7-Cre;Itpr1flox/flox mice were stained with anti–phospho-MARCKS (Ser152/156), anti-MARCKS, and anti-calbindin antibodies. Representative images are shown. (Scale bar, 20 μm.) Right shows quantification of the phosphorylation level of MARCKS in Itpr1flox/flox and L7-Cre;Itpr1flox/flox Purkinje cells. Fluorescent intensities of phospho-MARCKS and total MARCKS in Purkinje cells stained with calbindin were quantified, and the phosphorylation level was calculated by dividing the immunoreactivity of phospho-MARCKS by that of total MARCKS. **P < 0.01, Student’s t test. The numbers of neurons (D) or sections (E) are indicated in each graph.

