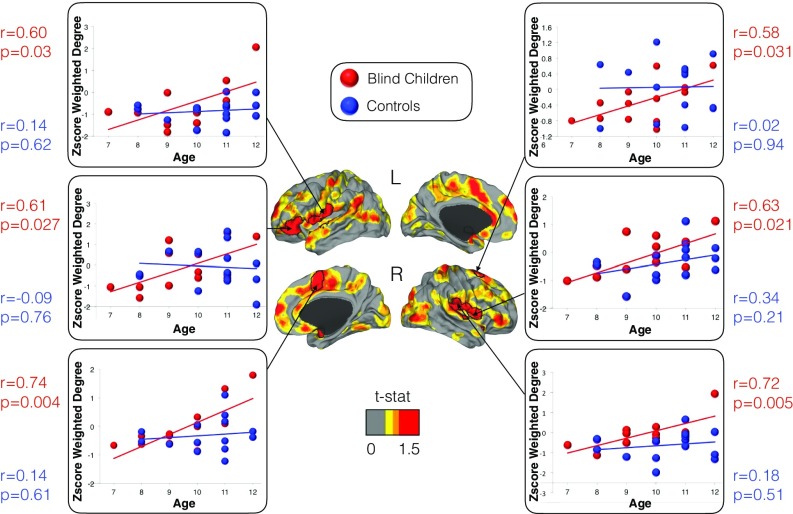
Fig. 2.
The effect of age on the connectivity pattern of blind children. Connectivity changes in multimodal integration regions were positively correlated with age in blind children. A color scale map based on t values is shown with red areas representing the effect of age (i.e., regions with increased connectivity with age) and black lines delineating statistically significant regions corrected for multiple comparisons. In the scatter plots, the connectivity at each significant region is displayed for each subject, with dots for blind children shown in red and those of controls shown in blue. The correlation coefficients and P values are presented next to each scatter plot, again in red for blind children and blue for controls.

