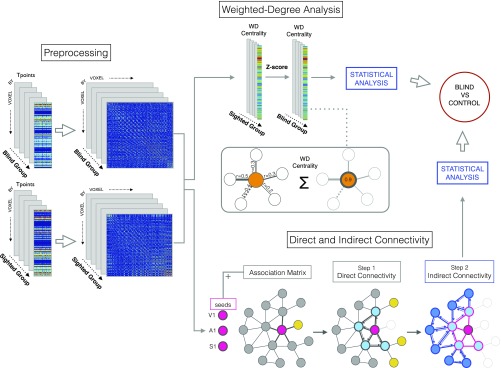
Fig. S1.
Image processing. The time series obtained from BOLD signal preprocessing was used to create a voxel by voxel functional connectivity matrix for each of the two groups (blind children and sighted controls). These matrices served as the inputs for resting-state functional connectivity and graph theory analyses. Next, the weighted degree of each voxel was computed and saved as the value representing the connectivity strength of each voxel (i.e., the sum of the correlations of each node with its neighbors) for the blind and control cohorts. A Z-score was then computed to normalize values and allow for group-level comparisons. Based on the same connectivity matrices, direct and indirect connectivity analyses were performed using three seeds as the starting point, localized in the primary auditory (A1), somatosensory (S1), and visual (V1) cortices. These regions are highlighted in the bottom right portion in dark pink. Direct connectivity with neighboring nodes (black links) was calculated using a graph theory approach, in which only direct connections from a node to connected neighboring nodes are considered [the nodes that were not connected to each other (shown in yellow) were later discarded]. For indirect connectivity analysis, we applied the same principle using direct connectivity nodes as seeds (for visualization purposes, note that direct connections are represented as pink triangles and light blue nodes, indirect connections are represented as blue triangles and dark blue nodes, and the discarded links are faded). Then, between-group statistical analyses were applied.

