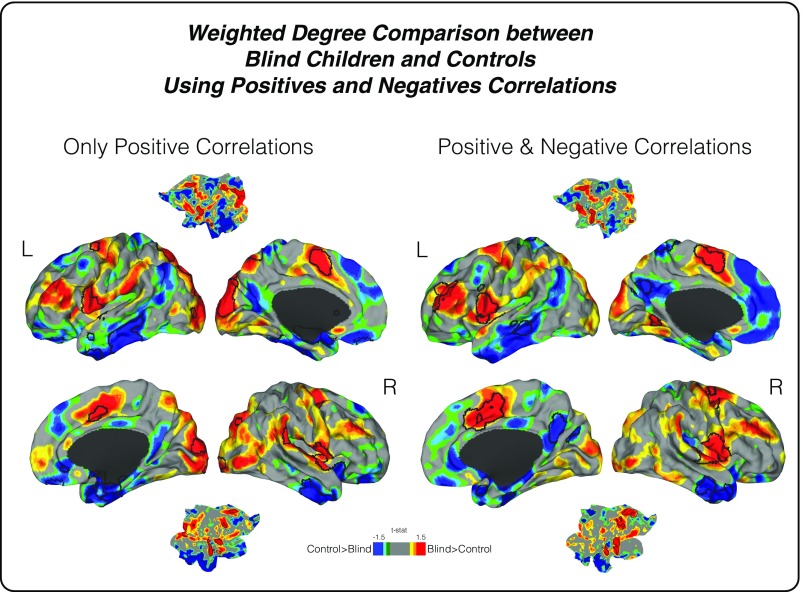
Fig. S2.
Connectivity reorganization in blind children. To compare two different methods for weighted-degree analysis, whole brain connectivity approaches (i) using only positive correlations (illustrated on the Left) and (ii) using both positive and negative correlations (illustrated on the Right) were performed. An uncorrected two-color scale map based on t values is displayed in which red areas have greater weighted-degree values in blind subjects and blue areas show higher connectivity in sighted controls. The black lines represent statistically significant regions. As noted, both analyses had similar results.

