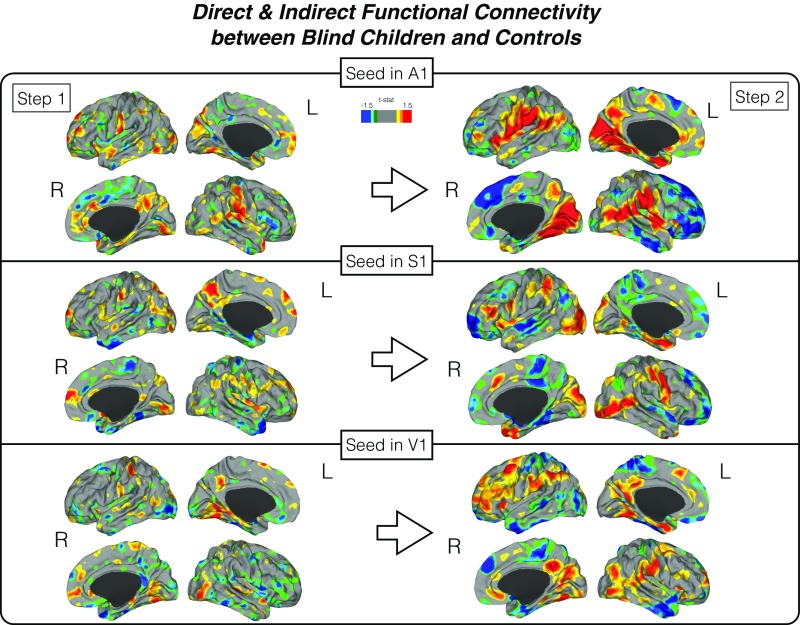
Fig. S3.
Direct and indirect functional connectivity. Differences in the direct (step 1) and indirect (step 2) connectivity between blind children and controls. The first step measures the direct connectivity from seeds located in the primary auditory, somatosensory, and visual areas. Indirect connectivity (step 2) measures indirect connections from the original seed in step 1. A two-color scale map based on t values is displayed in which areas with greater weighted-degree values are shown in red for blind children and blue for sighted controls.

