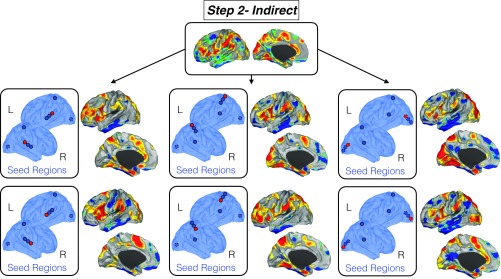
Fig. S5.
Replication of indirect functional connectivity using different primary seed locations. To check the stability of our results, we used different seed locations within the modal cortices in the indirect connectivity analysis. Top shows the map of indirect connectivity differences between blind children and controls reported in the main text. Middle and Bottom report the same map but using different primary seed locations (shown in red dots). Independently of the location of the seeds within the modal cortices, we found analogous findings.

