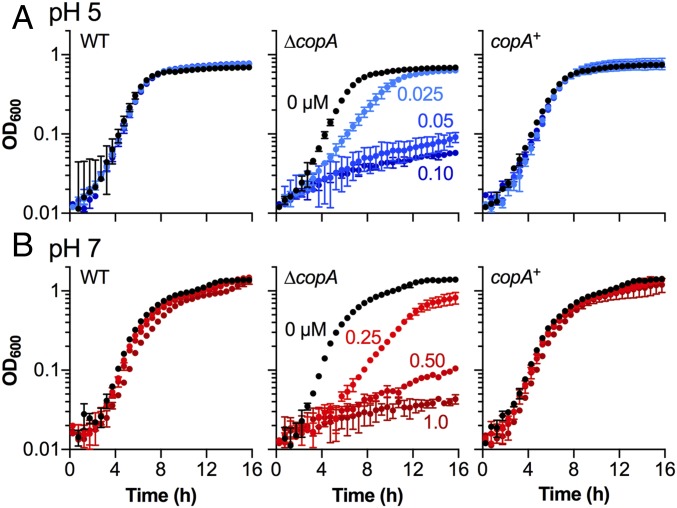
Fig. 2.
Cu stress during growth under different pH conditions. Growth of E. coli EC958 WT, ∆copA mutant, and copA+ complemented mutant: (A) at pH 5 in the presence of 0–0.10 µM added Cu and (B) at pH 7 in the presence of 0–1.0 µM added Cu. Data were averaged from three independent experiments. Error bars represent ±SD.

