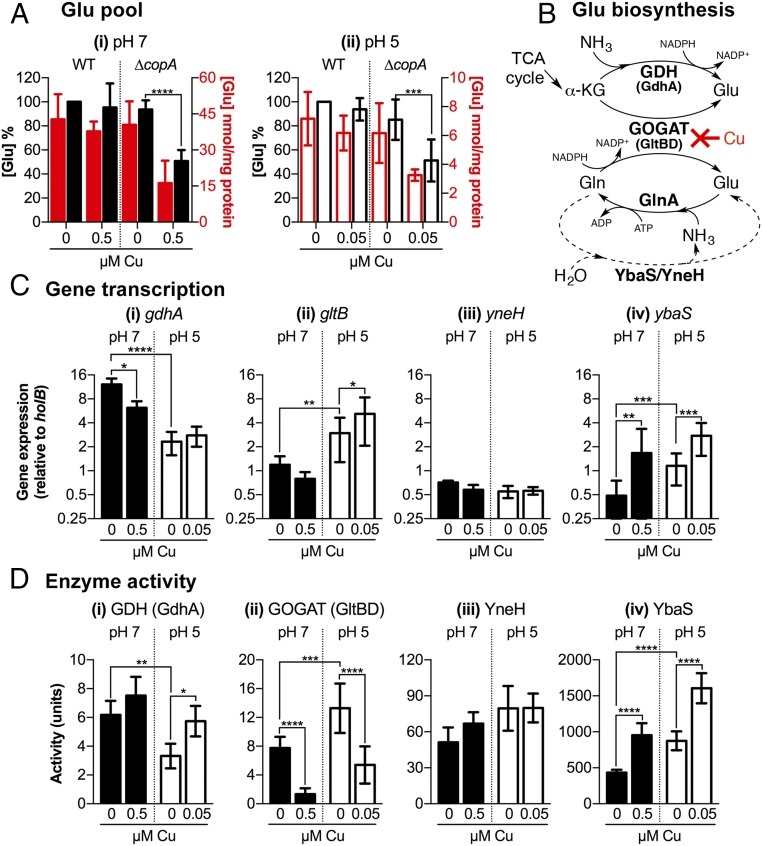
Fig. 4.
Effects of Cu on glutamate biosynthesis in E. coli. (A) Intracellular Glu concentrations. E. coli UTI89 WT and ∆copA mutant were cultured at (i) pH 7 or (ii) pH 5 with or without added Cu as indicated. Intracellular concentrations of Glu were shown as absolute values (red columns) or as a percentage relative to untreated WT (black columns). Data were averaged from five independent biological replicates. (B) Glu biosynthesis pathways. De novo synthesis of Glu begins with α-KG from the TCA cycle. This process is catalyzed either by GDH using ammonia as the nitrogen donor (Top pathway) or by GOGAT using Gln as the nitrogen donor (Middle pathway). Glu can also be generated by the hydrolysis of Gln. This process is catalyzed by YbaS or YneH (Bottom pathway). Our data show that excess Cu inhibits biosynthesis at the GOGAT step. The figure also shows one route of Glu consumption via GS, which also generates Gln. (C) Expression of Glu biosynthesis genes. The ∆copA mutant was cultured at pH 7 (black columns) or pH 5 (white columns) with or without added Cu as indicated. Amounts of (i) gdhA, (ii) gltB, (iii) yneH, and (iv) ybaS transcripts relative to holB were measured by qPCR. Data were averaged from six independent biological replicates. (D) Activities of Glubiosynthesis enzymes. The ∆copA mutant was cultured at pH 7 (black columns) or pH 5 (white columns) with or without added Cu as indicated. Activities of (i) GDH, (ii) GOGAT, (iii) YneH, and (iv) YbaS were measured in cell-free lysis extracts. Data were averaged from six independent biological replicates. (A, C, and D) Error bars represent ±SD; ****P < 0.0001, ***P < 0.001, **P < 0.01, and *P < 0.05.

