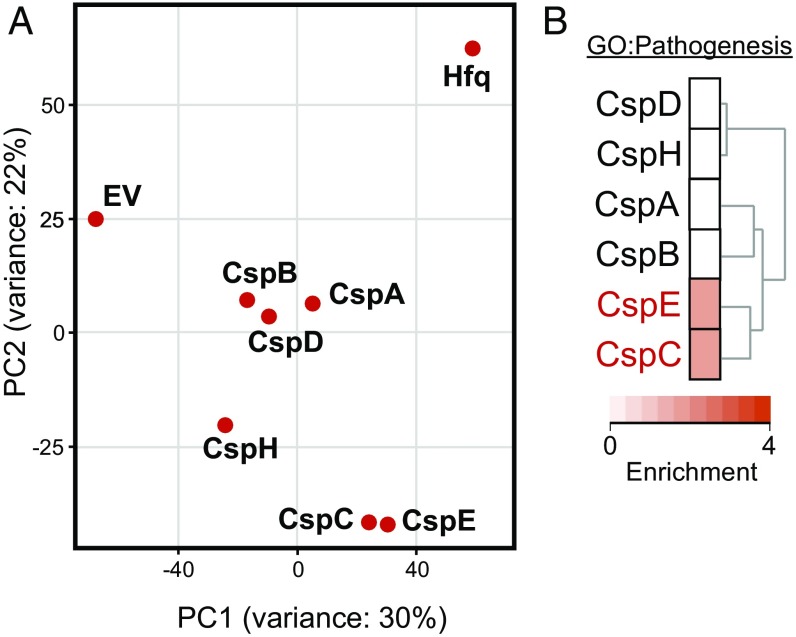
Fig. 2.
Global RNA ligand profiling of Salmonella CSPs. (A) PCA plot based on the transcripts identified by RIP-seq for each indicated protein or the control. EV, empty vector. (B) Enrichment of the GO term “Pathogenesis” in the transcripts identified by RIP-seq for each Salmonella CSP. The dendrogram on the right displays the clustering of the functional profiles.

