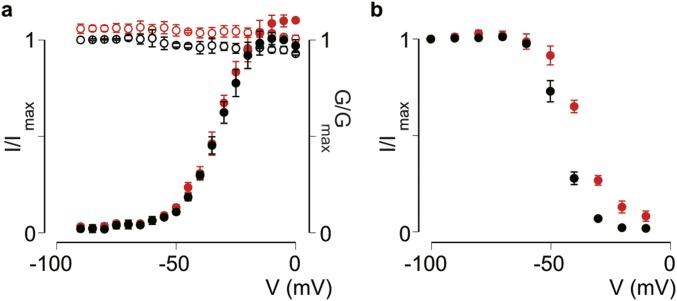
Fig. S3.
Effect of Hm1b on Nav1.1 WCW. (A) Activation–voltage (solid symbols, calculated G/Gmax) and steady-state inactivation (open symbols, I/Imax) relationships of Nav1.1 WCW before (black) and after (red) the addition of 500 nM Hm1b. The V1/2, control value of −33 ± 1 mV does not differ significantly from the V1/2, Hm1b value of −32 ± 1 mV. Steady-state inactivation curves were not fitted with the Boltzmann function. (B) Voltage dependence of slow inactivation for Nav1.1 WCW before (black) and after (red) the addition of 500 nM Hm1b toxin. V1/2, control = −45 ± 1 mV; V1/2, Hm1b = −38 ± 1 mV. Values are shown as mean ± SEM with n = 4.

