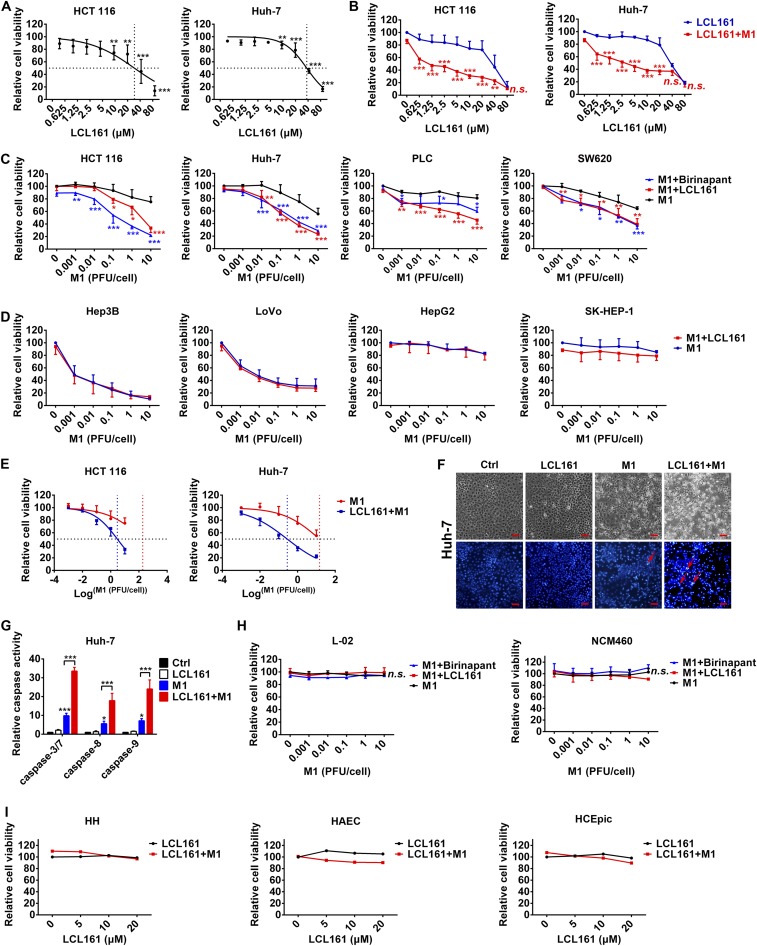
Fig. S1.
SMCs enhance M1-induced apoptosis in tumor cells, but not normal cells. (A) HCT 116 and Huh-7 cells were treated with different concentrations of LCL161 for 48 h, and cell viability was detected. The dose–response curves were fitted with nonlinear regression, and dotted lines indicate the IC50 value for each curve. (B) HCT 116 and Huh7 cells were treated with different concentrations of LCL161 with or without M1 [multiplicity of infection (MOI) = 1 pfu/cell] for 48 h, and cell viability was detected. Relative cell viability under LCL161 plus M1 treatment of each point was compared with cell viability under LCL161 treatment alone for statistical analysis. (C) HCT 116, Huh-7, PLC, and SW620 tumor cells were treated with different plaque-forming units of M1 with or without 5 μM LCL161 (or 5 μM birinapant) for 48 h, and cell viability was detected. Relative cell viability under M1 plus LCL161 (or birinapant) treatment of each point was compared with cell viability under M1 treatment alone for statistical analysis. (D) Hep3B, LoVo, HepG2, and SK-HEP-1 tumor cells were treated with different plaque-forming units of M1 with or without 5 μM LCL161 for 48 h, and cell viability was detected. (E) HCT 116 and Huh-7 cells were treated with different plaque-forming units of M1 with or without 5 μM LCL161 for 48 h, and cell viability was detected. The dose–response curves were fitted with nonlinear regression, and dotted lines indicate the IC50 value for each curve. (F) Phase-contrast and Hoechst 33342 staining (5 μg/mL for 10 min) for Huh-7 cells treated with M1 (MOI = 1 pfu/cell) with or without 5 μM LCL161 for 72 h. Red arrows indicate dead tumor cells showing severe karyopyknosis with Hoechst 33342 staining. (Scale bars: 50 μm.) (G) Relative activities of caspase-3/7, caspase-8, and caspase-9 were detected in Huh-7 cells treated as in D. (H) Cell viability was detected in normal cell lines L-02 and NCM460 treated with different plaque-forming units of M1 and 5 μM LCL161 (or birinapant) for 72 h. (I) Cell viability was detected in human hepatocytes (HH), human aortic endothelial cells (HAEC), and human corneal epithelial primary cells (HCEpic) treated with LCL161 and M1 (MOI = 10 pfu/cell) for 72 h. Error bars represent mean ± SD from three independent experiments. Ctrl, control, n.s., no significance. *P < 0.05; **P < 0.01; ***P < 0.001.

