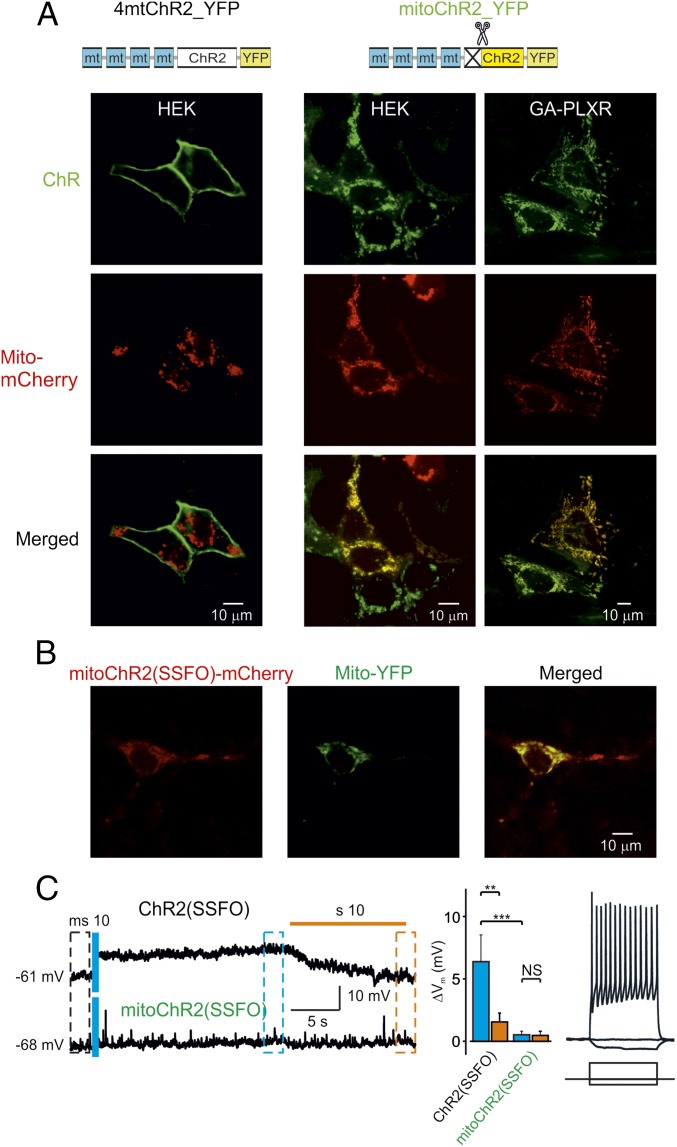
Fig. 1.
Rerouting ChR2 from the plasma membrane to the mitochondria. (A) Confocal images of cells coexpressing a fusion construct of four mitochondria-targeting peptides (Cox-8 4mt) with either the full-length (4mtChR2; Left) or 24-residue N-terminal truncated sequence of ChR2-YFP (mitoChR2; Middle Right) and a mitochondria-targeted Mito-mCherry. A schematic structure of the constructs is shown (Top). Yellow color indicates colocalization of the mitochondrial marker and mitoChR2. (B) Confocal images of neurons coexpressing mitoChR2(SSFO)-mCherry and Mito-YFP. (C) In hippocampal neurons, mitoChR2(SSFO) does not interfere with PM electrical properties. (C, Left) Representative current-clamp recordings from cells expressing mitoChR2(SSFO) or the plasma membrane-targeted ChR2(SSFO). The difference in membrane potential between neurons transfected with ChR2(SSFO) and mitoChR2(SSFO), −61 and −68 mV, respectively, is within the variability observed in different control neurons. As indicated, a short blue light pulse was applied for excitation (470 nm, 10 ms) and an orange light pulse (590 nm, 10 s) was applied for deactivation of the microbial rhodopsins. (C, Middle) Average voltage changes due to rhodopsin activation (blue bars) and inactivation (orange bars), calculated between times indicated by black, blue, and orange dashed boxes (Left) (n = 8). (C, Right) In mitoChR2(SSFO)-expressing neurons, current pulses delivered via the somatic patch pipette elicited either hyperpolarization or repetitive firing, indicating that the passive and active neuronal properties are intact. Data are presented as mean ± SEM. **P < 0.01, ***P < 0.001; NS, not significant.

