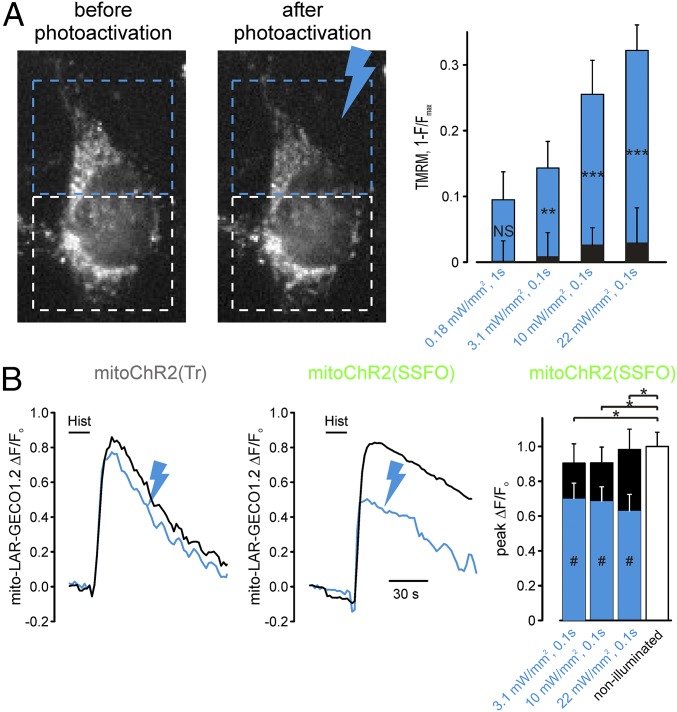
Fig. 7.
Subcellular interrogation of mitochondrial membrane potential and Ca2+ signaling by optometabolic tools. (A) Spatially confined illumination elicits localized light-dependent changes of Δψm in cells expressing the optometabolic constructs. (A, Left) Representative images of a TMRM-stained, mitoChR2(SSFO)-transfected HeLa cell before and 5 min after the blue light pulse (19.4 mW/mm2 for 50 ms) delivered to the region of the cell marked by the blue rectangle. The white rectangle defines the region of cells that has not been illuminated. (A, Right) The bar graph reports the mean change of 1 − F/Fmax (±SEM) in cells expressing mitoChR2(SSFO) elicited by the indicated illumination regimes, normalized to the response of cells expressing the mitoChR2(Tr) construct to correct for TMRM bleaching induced by the blue laser (Materials and Methods). Blue bars represent the photoactivated part of the cells, whereas black bars refer to the nonstimulated region of the cells. **P < 0.01, ***P < 0.001 between the signal obtained in the photoactivated and nonphotoactivated parts of the cell. (B) Spatially confined illumination controls mitochondrial Ca2+ signals in distinct cell regions. (B, Left) Representative mitochondrial Ca2+ transients (expressed as ΔF/F0) elicited by histamine application (100 μM) in cells cotransfected with mito-LAR-GECO 1.2 and either the mitoChR2(SFFO)-YFP or mitoChR2(Tr)-YFP construct (as indicated). As in A, part of the cell was illuminated with a light pulse (22 mW/mm2 for 50 ms; blue trace), whereas the other part was not (black trace). Illumination had little effect on Ca2+ signals in cells expressing mitoChR2(Tr)-YFP (Left). In contrast, the Ca2+ signals in mitoChR2(SFFO)-YFP cells were diminished in the illuminated region (blue trace) compared with the nonilluminated part of the cell. (B, Right) Means (±SEM) of the change in Ca2+ signals following illumination with the indicated light pulses in cells expressing the mitoChR2(SFFO)-YFP or mitoChR2(Tr)-YFP construct (as indicated). *P < 0.05 for all of the conditions between the two variants. #P < 0.05 between illuminated region (blue bar) and nonilluminated region (black bar) of the cell expressing mitoChR(SSFO). NS, not significant.

